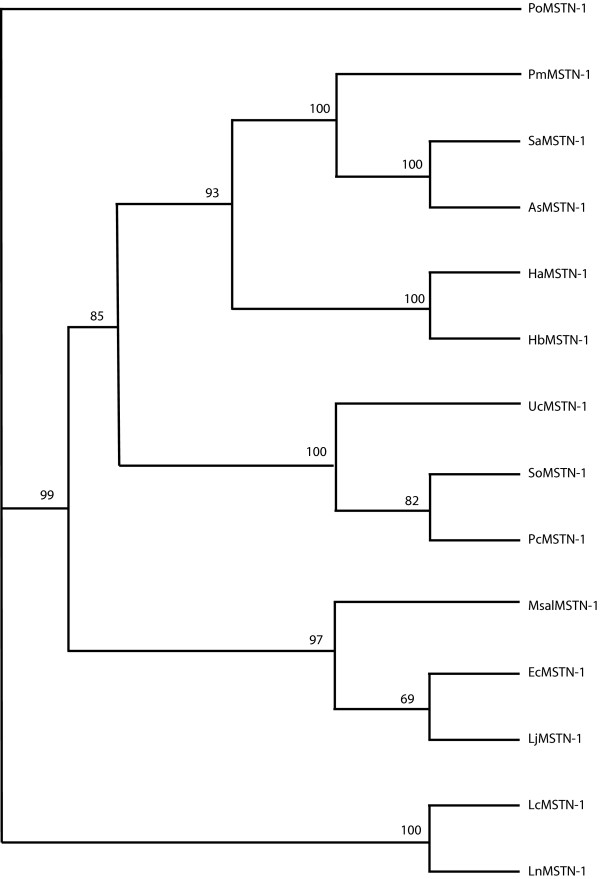
Figure 7.
Phylogenetic tree of perciformes whole MSTN-1 gene sequence. No outgroup was used for the whole gene analysis. Numbers at the tree nodes represent percentage bootstrap support after 1000 replicates. Species abbreviations are shown in appendix. Tree topology and statistical support were similar for the NJ analysis (not shown).

