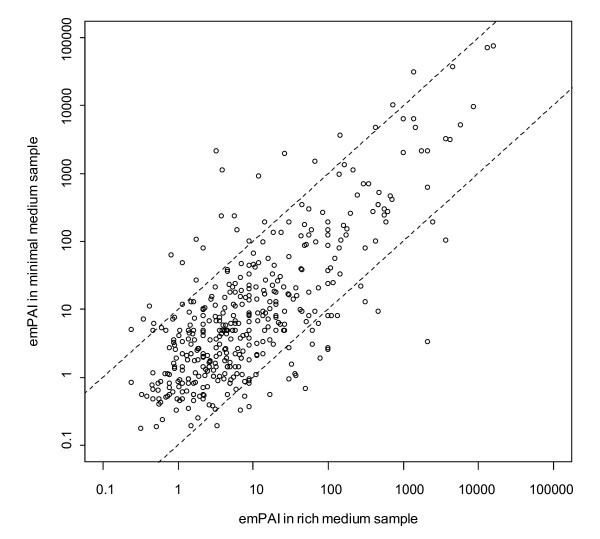
Figure 1.
Comparison of protein abundances in the E. coli cytosol of cells cultured in minimal and rich medium. Protein abundance as derived by emPAI values. 454 proteins with more than two identified peptides were evaluated in samples from minimal and rich medium. The dashed lines indicate the positions equivalent to a concentration ratio of 0.1 and 10. The emPAI values in the minimal and rich medium correlate significantly with a Pearson correlation coefficient of 0.7 (pval < 10-54) and 0.77 (p-value < 10-80) for logrithmized variables.

