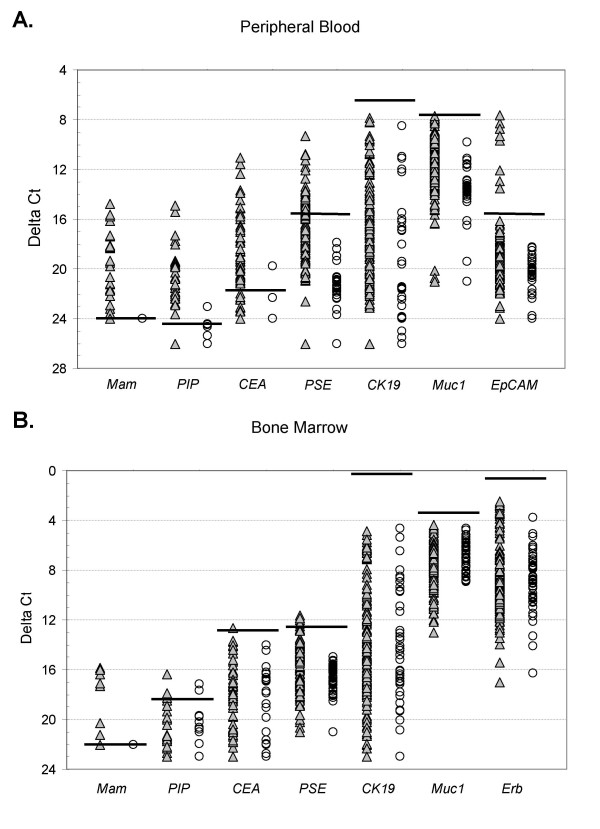
Figure 1.
Real-time RT-PCR analysis of cancer-associated gene expression in peripheral blood (A) and bone marrow (B) from breast cancer patients (filled triangle) and in normal control blood and bone marrow samples (empty circles). ΔCt values were obtained by subtracting the mean Ct value of β2-microglobin from the mean Ct value of each respective gene. Ct values for each gene were determined from triplicate reactions. Horizontal lines indicate ΔCt threshold values (3 standard deviations from the mean). The ΔCt threshold for each gene are as follows: Peripheral blood: mam 24.00, PIP 24.19, CEA 21.93, PSE 15.28, CK19 6.32, muc1 7.57, EpCAM 15.49; Bone marrow: mam 22.00, PIP 18.32, CEA 12.64, PSE 12.48, CK19 0.20, muc1 3.41, ErbB2 1.77.

