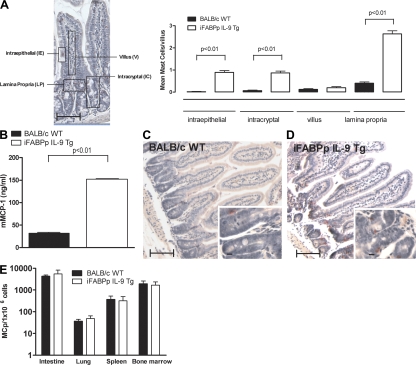
Figure 3.
Intestinal mastocytosis in iFABPp-IL-9Tg mice. Localization of mean number of mast cells in the small intestine (A) and serum mMCP-1 in WT and iFABPp-IL-9Tg mice (B). (C and D) Photomicrograph of CAE-stained jejunum sections of BALB/c WT (C) and iFABPp-IL-9Tg mice (D). (E) Mast cell progenitor levels in the intestine, lung, spleen and BM of iFABPp-IL-9Tg and BALB/c WT mice. (A–E) Data represented as the mean ± the SEM; 4–5 mice per group from n = 4 experiments. A is a pictorial representation of localization determination. (C and D) Photomicrograph, 10× magnification; insert, 40× magnification. (E) Data represented as the mean ± the SEM; 4 mice per group. Bars: (capped) 100 μm; (uncapped) 10 μm.

