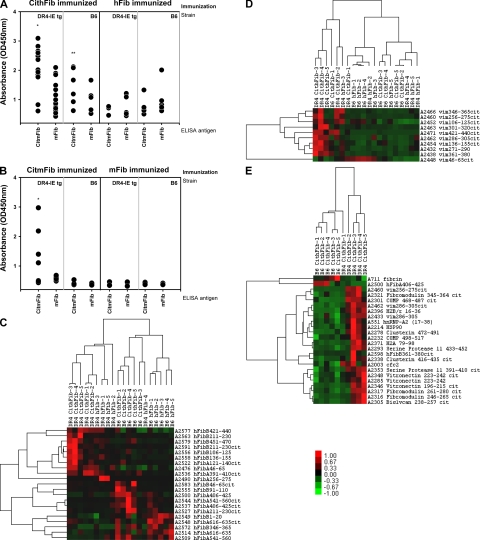
Figure 6.
IgG antibody responses detected by ELISA and synovial proteome microarray. (A) IgG reactivity to either CitmFib or mFib in DR4-IE tg or B6 mice 70 d after immunization with either CithFib or hFib. Mean OD of duplicates for individual serum are shown (n = 12 for DR4-IE tg mice immunized with CithFib and n = 6 for all other groups). (B) Total IgG reactivity to either CitmFib or mFib in DR4-IE tg or B6 mice 100 d after immunization with either CitmFib or mFib (n = 7 for DR4-IE tg mice immunized with CitmFib and n = 5 for all other groups). * indicates significant difference in antibody reactivity (P < 0.05, paired Student's t test) between all groups, whereas ** indicates significant difference in antibody reactivity to CitmFib in B6 mice immunized with CithFib versus reactivity to CitmFib in B6 or DR4-IE tg mice immunized with hFib (P < 0.05, paired Student's t test). Analysis of serum IgG reactivity to fibrinogen- (C) or vimentin-derived (D) peptides identified by SAM and grouped by Cluster based on relationships. (E) Pairwise analysis of significantly different IgG antibody reactivity between DR4-IE tg and B6 mice immunized with CithFib (P < 0.05, Student's t test). Antigens shown were stratified based on having greater than fourfold increase in reactivity compared with immunization with hFib. Values shown are median subtracted and row normalized with relative expression shown in relation to scale bar. Raw data and peptide sequences can be found in Table S1–S3, available at http://www.jem.org/cgi/content/full/jem.20072051/DC1.

