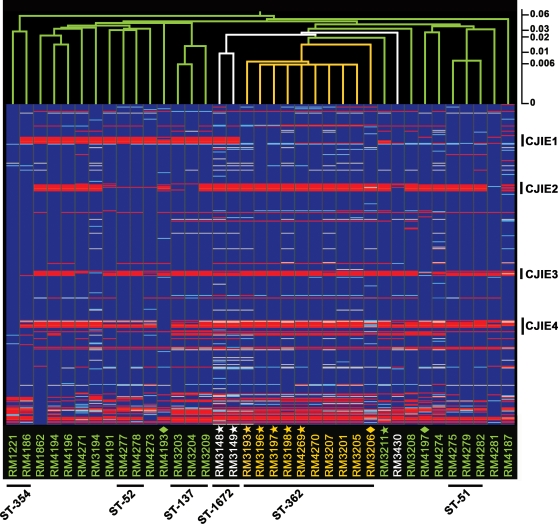
Figure 2. Genome comparison of Campylobacter jejuni clinical strains by DNA microarrays analysis.
An average linkage hierarchical clustering of the C. jejuni strains with a distance score scale bar was compiled in GeneSpring version 7.3 with the standard correlation and bootstrapping (see Materials and Methods). The gene status based on cutoff values of absence and presence predictions is shown color-coded: blue, present; light blue, divergent; red, highly divergent or absent; white, no data. C. jejuni strains from South Africa with HS∶41 serotype (yellow), with other serotypes (green), or strains with HS∶41 serotype from Mexico and Canada (white) are designated vertically across the bottom. GBS-associated strains are annotated with stars; MFS-associated strains are annotated with diamonds. The four C. jejuni-integrated elements (CJIEs) and the assigned MLST sequence type (ST) for each strain cluster is indicated.

