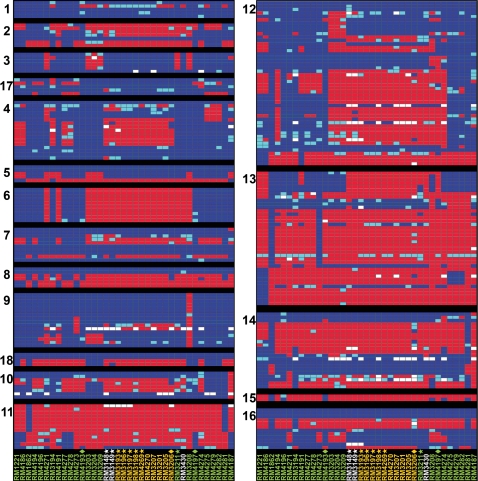
Figure 3. Patterns of presence, absence or divergence in the 18 hypervariable regions in Campylobacter jejuni strains.
A detailed genomic analysis of the 18 hypervariable regions (Table 2) was compiled in GeneSpring version 7.3 with the standard correlation and bootstrapping (see Materials and Methods). Each panel represents a hypervariable region, and each column corresponds to a C. jejuni strain designated vertically across the bottom, as described in the legend to Figure 2. The gene status based on cutoff values of absence and presence predictions is shown color-coded: blue, present; light blue, divergent; red, highly divergent or absent; white, no data.

