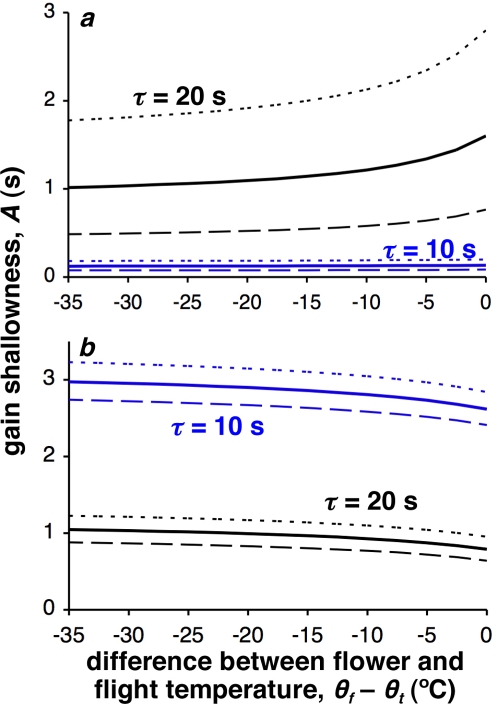
Figure 3. An increase in floral temperature means that nectar production can be reduced.
a) Lines show paired values of floral temperature (shown as the difference between floral temperature and take-off temperature, θt−θf) and gain shallowness constant A (where a larger value means that it takes longer for the bee to collect a given amount of nectar), yielding the same optimal net rate of gain (for illustrative purposes, the lines represent the isocline where r* = 0.05 J s−1); b) temperature and gain shallowness pairs yielding the same optimal visit length, td (for illustrative purposes, the lines represent the isocline where td* = 7.5 s). In both figures, the solid black line uses the standard parameter set as described in the methods section, where travel time τ = 10 s. The solid blue line uses the same parameter set, but τ = 20 s. The dotted and dashed lines demonstrate a change in the cost of flight ct (standardised at 0.336 J s−1), representing one way in which non-floral environmental temperature can be included: the dotted lines use ct = 0.9×0.336 J s−1, and the dashed lines use 1.1×0.336 J s−1.

