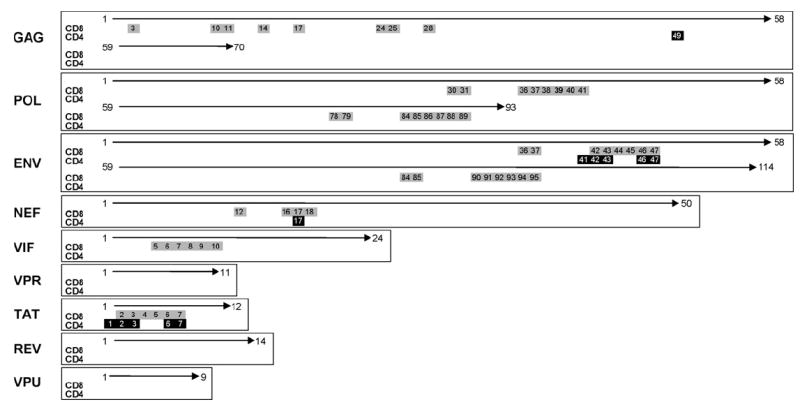
Fig. 2.

Representative patient data showing individual CD4+ and CD8+ peptide responses across the entire HIV-1 genome. Genome regions are shown on the left hand side of the figure with positive CD4+ responses (black boxes) and CD8+ responses (grey boxes) with peptide numbers indicated.
