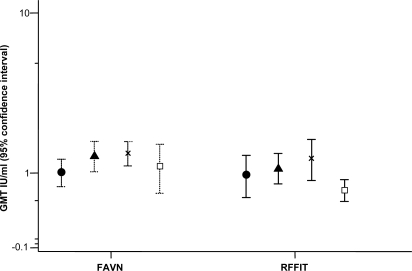
Figure 4. Rabies fluorescent focus inhibition test (RFFIT) results of the day 7 sera plotted with the results of the same sera tested by the fluorescent antibody virus neutralisation (FAVN) method.
Symbols represent: • Group A 4-site; ▴ Group B 8-site; x Group D 2-site; □ Group E IM. Points are geometric mean titres with 95% confidence intervals.

