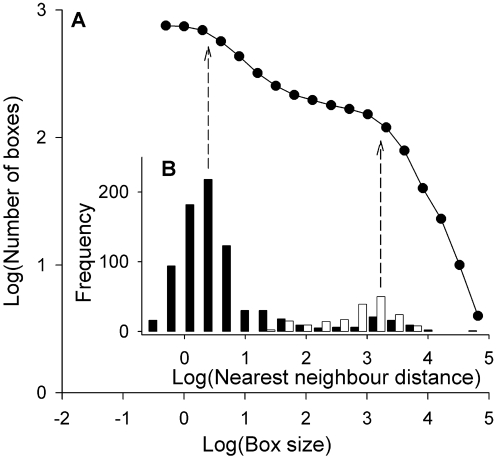
Figure 5. Scaling in the distribution of Lesser kestrel nests spatial distribution.
A, Box-counting plot of the spatial distribution of nests in the most populated year in the Ebro Valley. B, Distribution of nearest neighbor distances between nests (black) and between colonies (white). All distances are in meters. Note the match between the mean distances and the inflection points (departing the pattern from a straight line, and thus from a fractal-like nest distribution pattern) in the box-counting plot. The small number of large between-nest distances corresponds to solitary nests for which the nearest nest is far away (in the closest colony).

