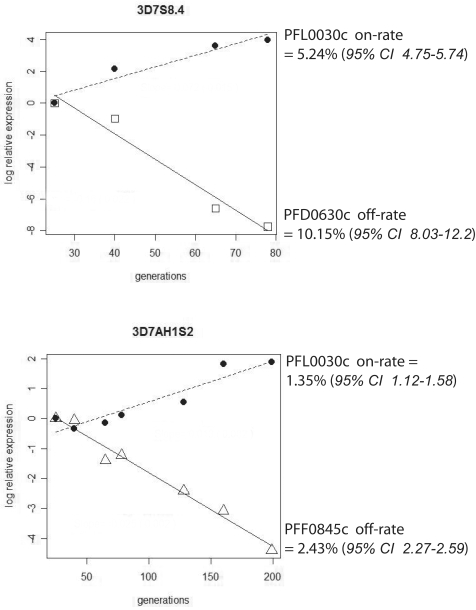
Figure 1. “On” and “Off” switching rate of dominant var and var2csa in 3D7S8.4 and 3D7AH1S2.
Regression models were created by using the log of comparative expression level, log(2ΔΔCt) versus generations. In the case of 3D7S8.4, a linear range of regression was observed up to ∼100 generations. Thus, the var on/off rates for 3D7S8.4 were determined up to 100 generations, whilst for the 3D7AH1S2, the estimations were made up to 200 generations, as the linear regression was maintained for a longer time period. The var on/off rates for 3D7S8.4 and 3D7AH1S2 were determined by the 2−ΔΔCt method, where ΔΔCt = (Ctvar−Cthouse-keeping)tn−(Ctvar−Cthouse-keeping)t0. The value for the first data collection (t0) was set as the baseline level (i.e. 15 and 25 generations for 3D7S8.4 and 3D7AH1S2, respectively.) The fold-change in the transcription compared to the baseline level was plotted, and the on/off rates of particular var-genes were estimated by the exponential function of the slope of the regression.

