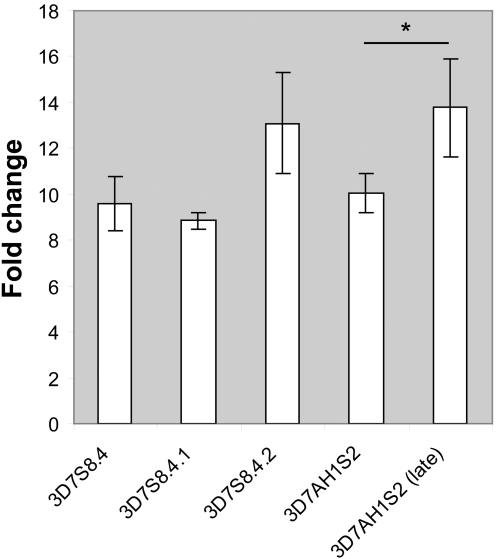
Figure 7. Quantitative differences in complete cycle multiplication rates between different parasites.
Mean of fold change per erythrocytic cycle for at least three consecutive 48 hour cycles were calculated from blood smear parasitemias. Significant differences between “early” versus ”late” generation clones (3D7S8.4 vs 3D7S8.4.1; 3D7S8.4 vs 3D7S8.4.2 and 3D7AH1S2 vs 3D7AH1S2 late) were determined using an unpaired Student́s t-test at a 5% significance level. Analysis was performed in SPSS version 12.0. *P<0.05; Significantly higher multiplication rate was observed in the late S2-clone. The same trend was also observed in the other VAR2CSA expressing late generation clone S8.4.2, the difference here however was not statistically significant (P = 0.067).

