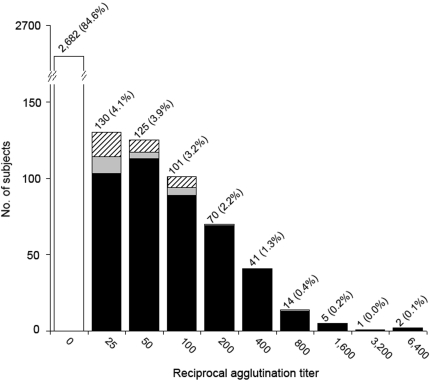
Figure 2. Distribution of reciprocal microscopic agglutination test titers for 3,171 subjects from the slum community site.
Labels above the bars indicate the number of subjects (% of total), according to their highest reciprocal titer. The open bar represents seronegative subjects. Subjects with highest reciprocal titres against L. interrogans serovar Copenhageni, multiple serovars and serovars other than Copenhageni are shown as black bars, grey bars and crosshatched bars, respectively.

