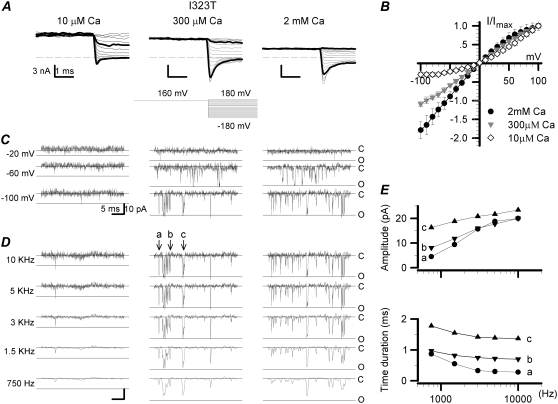
FIGURE 3.
Characteristics of both the instantaneous and single-channel currents of the mutant I323T at higher intracellular Ca2+. (A) The instantaneous currents of I323T were recorded from an inside-out patch in symmetric 160 mM K+ solutions with intracellular 10 μM, 300 μM, and 2 mM Ca2+, respectively. The voltage protocol is plotted at the bottom middle. Traces in thick black lines represent currents at +100 and −100 mV, respectively. The dashed lines are zero currents. (B) The normalized instantaneous currents of I323T (± SD) are plotted against voltages in the presence of 10 μM, 300 μM, and 2 mM Ca2+, respectively. (C) Traces of the I323T single-channel currents were obtained at −20, −60, and −100 mV, in the presence of 10 μM, 300 μM, and 2 mM Ca2+, respectively. The single-channel currents were filtered at 10 kHz. Solid lines labeled with “c” and “o” represent the closed and open levels, respectively. (D) The representative single-channel currents of the mutant I323T were recorded at −100 mV in 10 μM, 300 μM, and 2 mM Ca2+ and filtered at 10 kHz, 5 kHz, 3 kHz, 1.5 kHz, and 750 Hz (Gaussian low-pass filter; −3 dB) as indicated. Arrowheads with letters “a,” “b,” and “c” indicate three full-open events with different open-time durations. (E) The amplitude (upper) and the open time duration (lower) of events in “a” (•), “b” (7), and “c” (6) are plotted with filtering frequencies. The open-time durations were measured from the roots of pulses, and the amplitudes from the peaks of pulses. At 10 kHz, 5 kHz, 3 kHz, 1.5 kHz, and 750 Hz, the values of amplitude (in pA)/open time duration (in ms) are, for “a,” 20.0/0.28, 18.8/0.30, 15.7/0.33, 9.4/0.55, and 4.5/0.87; for “b,” 20.0/0.70, 17.7/0.72, 16.0/0.75, 11.8/0.82, and 8.1/0.97; for “c,” 23.4/1.37, 21.7/1.39, 20.8/1.42, 18.8/1.55, and 16.3/1.78, respectively.

