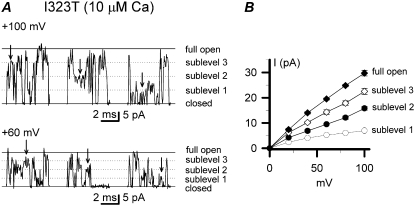
FIGURE 4.
Subconductance levels of the mutant I323T. (A) The representative single-channel subconductance levels as indicated by arrows are exhibited at +100 mV and +60 mV, respectively. Solid lines labeled with “c” and “o” represent the closed and open levels, respectively. Dotted lines represent subconductance levels as indicated. (B) Current-voltage curves are plotted for the full-open and sublevels (n = 4–7). All single-channel levels of currents were measured manually.

