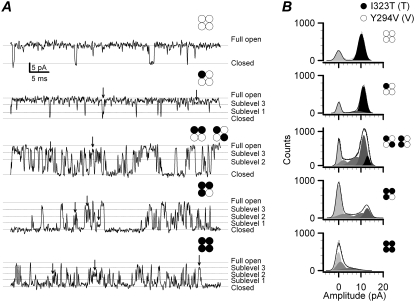
FIGURE 6.
The subconductance levels of the heterogeneous channels coexpressed with the mutant I323T and the TEA-insensitive mutant Y294V. (A) Examples show the single-channel subconductance levels at +50 mV with 10 μM Ca2+ for each combination indicated by the construct symbol. As the number of I323T subunits in the heterogeneous channel increases, the subconductance events indicated by arrows occur more often, and the open-time durations obviously become much shorter too (n = 3–5). Solid lines labeled with “c” and “o” represent the closed and open levels, respectively. Dotted lines represent each subconductance level as indicated at the right. (B) Amplitude histograms of currents for each heterogeneous channel are shown at the left column. The amplitudes of the full-open currents from the top to the bottom panel are 10.5 ± 0.5, 11.5 ± 0.4, 14.8 ± 0.6, 12.8 ± 0.3, and 14.6 ± 0.6 pA, respectively. The construct symbols for each composition are shown at the right of each graph.

