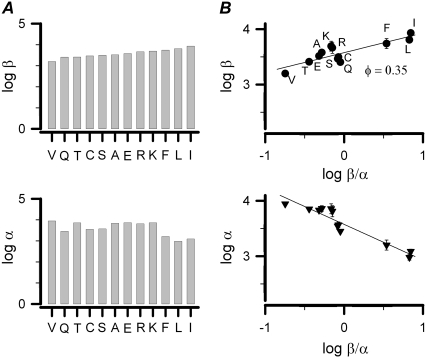
FIGURE 8.
REFER analysis on the site I323 of mSlo. (A) With the software QuB, single-channel recordings in Fig. 7 were analyzed to obtain the αs, βs, and weight of each state. The equivalent α and β of the simplified C-O model were calculated from the formula described in the legend of Scheme 1. Logarithms of the open (β) and closed (α) rate constants are plotted for the I323 mutants in an increasing order of equilibrium constant (K = β/α), respectively. Each mutant is represented with an abbreviated letter of its substituted residue. (B) Log β and log α are plotted with log K, respectively. The symbol (•) of each mutant is labeled with an abbreviated capital letter of its substituted residue. Here, the φ value equals log β/log K (n = 3–4).

