FIGURE 4.
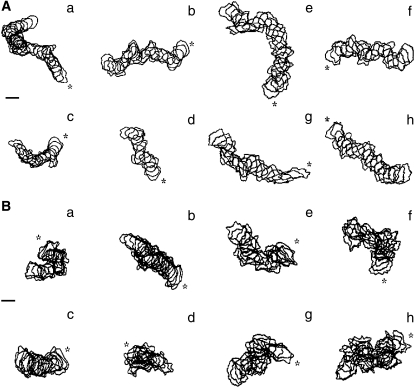
Shape and migration pattern of experimental and model Dictyostelium, for control cells (A) and nocodazole-treated cells (B). The path is shown as overlapping cell contours from four representative experimental (a–d) or model (e–h) cells. Interval between successive cell contours is 40 s. Model cells are generated with parameters from one of the PSO solutions near the centroid of the set of answers. Asterisks indicate the starting point of the path. Scale bar, 50 μm.

