FIGURE 5.
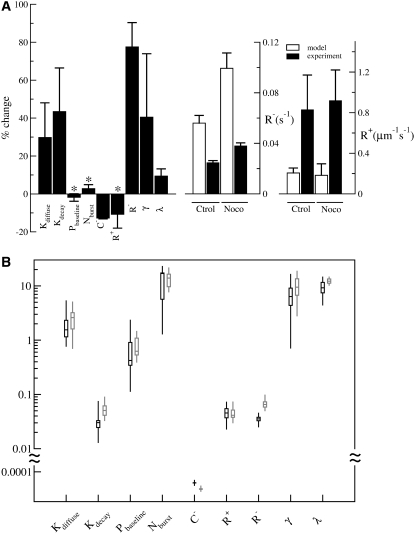
(A) Parameters that generate the behavior of nocodazole-treated Dictyostelium cells relative to those for control cells. Black bars indicate the percentage change of each of the parameters upon nocodazole treatment (left). Asterisks indicate statistically insignificant differences (p > 0.005). White bars indicate retraction and protrusion rates predicted by the model using PSO, whereas black bars indicate experimentally measured retraction and protrusion rates (center and right). Error bars are standard deviations over the optimization solution space. (B) Box plot representation of the distribution of parameters for generating the behavior of control (black; same as in Fig. 2 A) or nocodazole-treated Dictyostelium (gray).

