FIGURE 5.
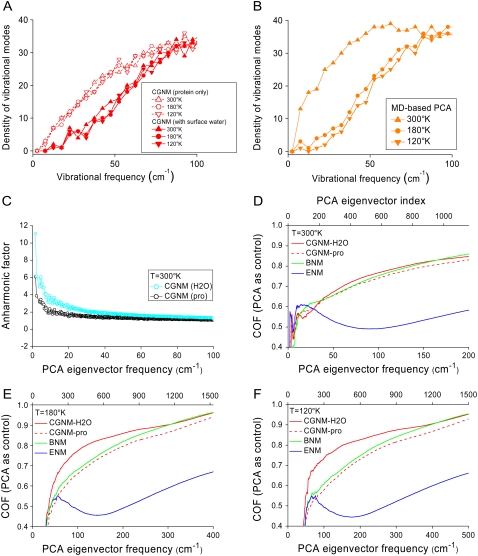
Effects of solvent on protein dynamics determined by CGNM and MD approaches. (A) Distributions of the vibrational mode densities for CGNM without water (open symbols) and CGNM with water (solid symbols) at three temperatures, 300 K (triangles), 180 K (open circles), and 120 K (inverted triangles). (B) Distributions of the vibrational mode densities for MD simulations at 300 K (triangles), 180 K (circles), and 120 K (inverted triangles). All plots are shown in brown to be consistent with Fig. 4. (C) Anharmonic factor for the PCA modes from MD simulations at 300 K based on harmonic CGNM modes without (black) or with (blue) surface water. (D) COF curves showing the overlap between the eigenvectors from MD simulations at 300 K and CGNM with water (red solid line), CGNM without water (red dashed line), BNM (green), or ENM (blue). (E) COF results showing the overlap between MD results and CGNM, BNM, and ENM results at 180 K. (F) COF results showing the overlap between MD results and CGNM, BNM, and ENM results at 120 K.

