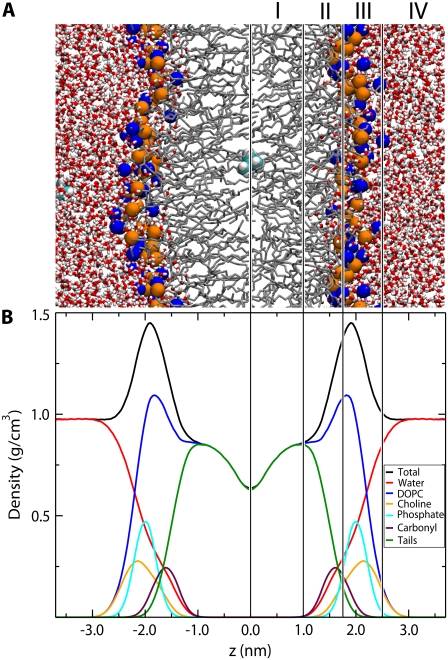
FIGURE 1.
Snapshot and partial density profiles of the simulated system. The lines and roman numerals divide the system into four regions as described in the text. (A) Snapshot of the simulated system. The lipid nitrogen and phosphate atoms are shown as blue and orange spheres respectively. Water is shown as red (oxygen) and white (hydrogen) cylinders. The lipid tails are shown as thin gray lines. Two valine side chains are shown as cyan (carbon) and white (hydrogen) spheres. (B) Partial density profile for the system.

