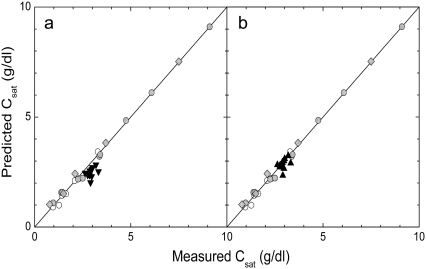
FIGURE 4.
Correlation of predicted and measured solubility. (Left) The data gelled at 37°C and measured at 22°C are shown as solid triangles, using the assumption that the correct temperature is the gelation temperature, 37°C. As can be seen, the points are not so well correlated as the other data. (Right) The correlation resulting when the appropriate temperature is taken to be 25°C. Light gray symbols represent the data from Table 2. (Open circles) 22°C data published previously (4); (solid circles) 22°C data determined here; (diamonds) 37°C data determined here.

