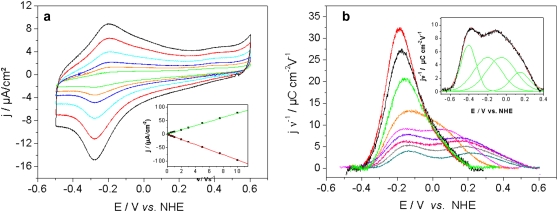
FIGURE 2.
Cyclic voltammograms of CcO with the his-tag attached to SU II under strictly anaerobic conditions. (a) Scan rates a between 0.1 and 1 Vs−1, 0.01 V s−1 (green), 0.02 V s−1 (orange), 0.03 V s−1 (dark blue), 0.05 V s−1 (light blue), 0.075 V s−1 (red), and 0.1 V s−1 (black). (Inset) Baseline-corrected current density plotted as a function of scan rate, reductive branch (red), oxidative branch (green). (b) Oxidative branches (baseline-corrected) of CVs at scan rates between 1 and 600 Vs−1 (current densities normalized by the scan rate, ν ≅ 1 Vs−1) 1 V s−1 (red), 3 V s−1 (black), 7.5 V s−1 (green), 20 V s−1 (orange), 40 V s−1 (pink), 300 V s−1 (blue), 400 V s−1 (violet), 500 V s−1 (gray), 600 V s−1 (light blue). (Inset) Example of a deconvolution into four Gaussian components.

