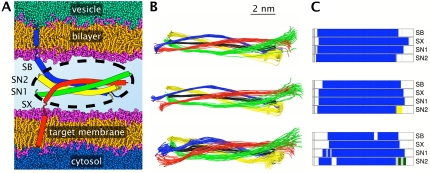
FIGURE 1.
Schematic view of the SNARE complex embedded in the vesicular and target membranes. (A) Inside of the vesicle represented in green and the cytosol in blue. Lipid headgroups are shown in pink, aliphatic tails in orange. The four helices of the complex are synaptobrevin (Sb, blue), syntaxin (Sx, red), and SNAP-25 (Sn1 and Sn2, green and yellow). The palmitoylated linker of SNAP-25 is not shown. The solvent in the space separating both membranes is omitted for clarity. The black, dotted ellipse represents the cytosolic core of the complex that was simulated using molecular dynamics. (B) Cumulated snapshots of the helical axes determined using P-Curves. The overall helical axis is shown in black. Results for the last 2 ns of the three simulation systems Q1 (top), Q2 (center), and Q2GB (bottom) are presented at a 100-ps interval. (C) Dominant secondary structure present for >90% of the total simulation time for Q1, Q2, and Q2GB from top to bottom. The color code is α-helix, blue; bend, olive; turn, yellow; and coil, gray.

