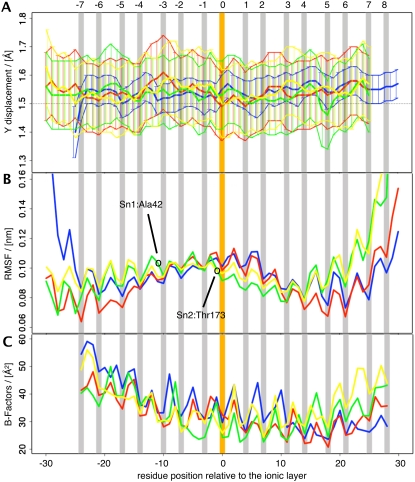
FIGURE 4.
Flexibility analysis using P-Curves (top, A); root mean-square fluctuations (RMSF; middle, B); and experimental B-factors (bottom, C). (A) The Y-displacement parameter as a function of residue position with respect to the central ionic layer at 0 averaged over the last 8 ns of simulation Q1. The same color code as in Fig. 1 is used. Error bars are shown along with upper and lower boundary plots to facilitate the visual comparison of the fluctuations. (B) RMSF of simulation Q1 after least-squares fitting of the whole trajectory with respect to the Cα atoms of the 16 layers. (C) B-factors averaged for all available crystal structures.

