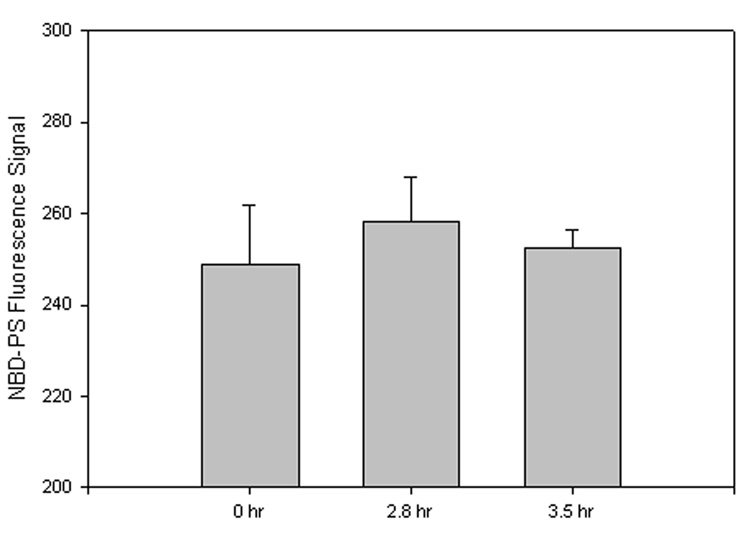
Figure 2. PMI NBD-PS assay.
FVB mouse synaptosomes were treated with the fluorescent phospholipid NBD-PS. PtdSer exposure to the outer leaflet of the plasma membrane is measured as a decrease in fluorescence signal, compared to 0 h, after quenching with Na2S2O4. Since samples were not compared as a percentage of control, negative values are not seen, but graphical interpretation is relatively the same. A fluorescence decrease, compared to 0 h, denotes an increased amount of PtdSer exposed to the lipid bilayer outer leaflet. Data shown in arbitrary fluorescence units on the ordinate axis as mean ±S.D. 0 h, N=3; 2.8 h, N=2, P<0.65; 3.4 h, N=3, P<0.80.

