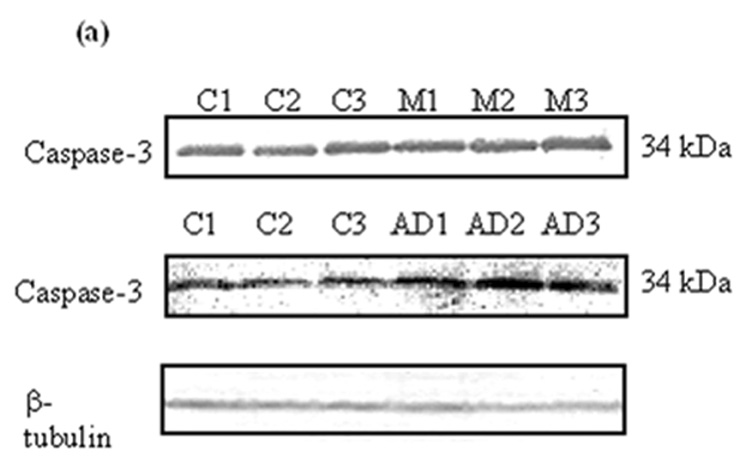
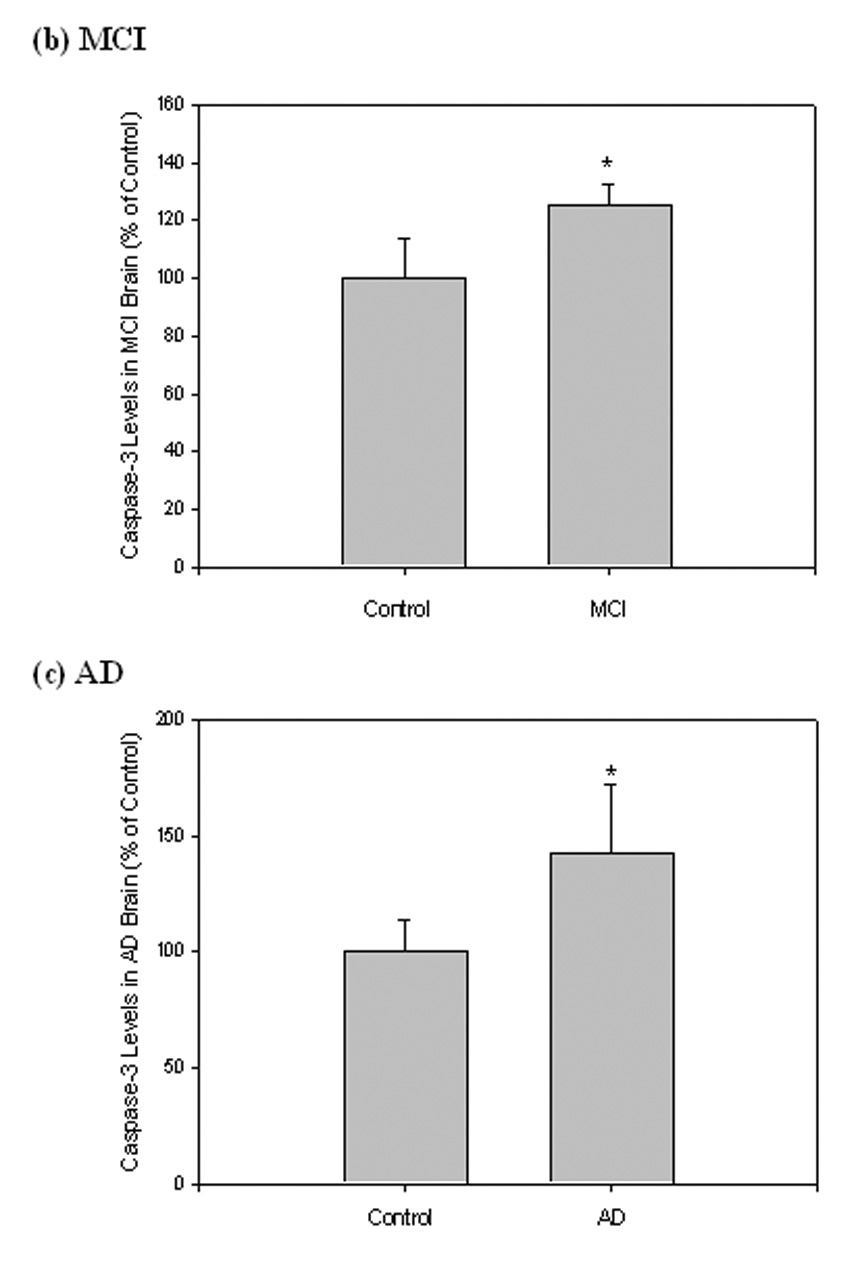
Figure 6. Caspase-3 levles in brain from subjects with MCI and AD.


Caspase-3 levels were measured in IPL of MCI and AD patients by Western blot analysis. (a) MCI and AD gels were run with equal amounts of protein (75 µg/lane). Increased band intensity after normalization with β-tubulin represents an increase in the amount of caspase-3 present. (b) & (c) Graphical analysis of MCI and AD band intensities, respectively. The control value was set to 100%, to which experimental values were compared. Data shown in arbitrary units on the ordinate axis as mean ±S.D. in (a) MCI, N=3, *P<0.02; in (b) AD N=3, *P<0.04.
