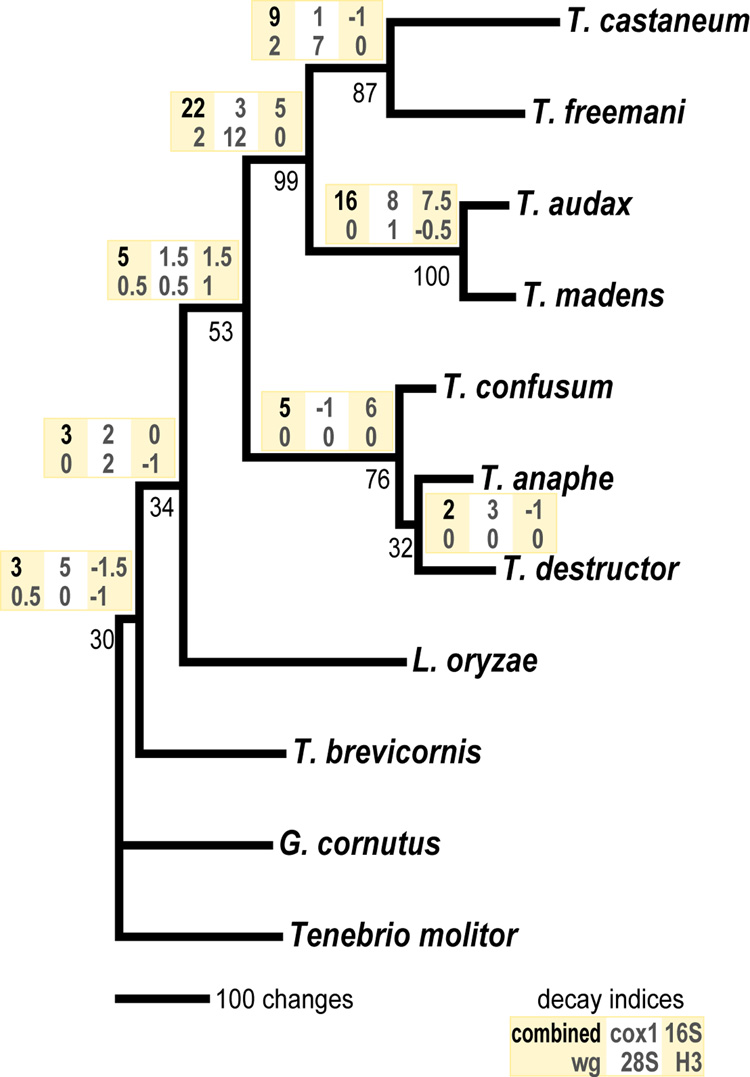
Figure 2.
Most parsimonious tree based on combined analysis of cox1, 16S rDNA, wg, 28S rDNA, and histone H3. This analysis excluded codon third positions from wg and histone H3 based on failure of the base homogeneity test (P ≪ 0.01). Decay indices based on the combined dataset and each partition are given above each branch. Bootstrap values are given below branches.

