Abstract
To exceed the throughput and accuracy of conventional sequencing technologies, we tested a method (pyrophosphorolysis-activated polymerization - PAP) of nucleic acid amplification that uses 3' blocked primers (P*s). As proof of principle, we resequenced a 20-bp region of the factor IX gene with a microarray of P*s. P*s discriminate 3' end mismatches with ultra-high specificity, as well as mismatches along their lengths with high specificity. We correctly identified two wild type samples as well as all mismatches, including three single-base substitutions, one microdeletion, one microinsertion, and one heterozygous mutation. Despite limitations in the primer purity, the signal to noise ratio between the matched and mismatched P*s sometimes exceeded 1,000. Thus PAP-R shows great potential for accurate and high-throughput microarray-based resequencing.
Keywords: DNA sequencing, resequencing, mutation detection, pyrophosphorolysis-activated polymerization, DNA amplification
Introduction
Resequencing involves sequencing known nucleic acid regions to detect unknown mutations. The throughput of conventional Sanger sequencing limits molecular epidemiological analysis and clinical diagnosis. A high throughput, accurate, non-gel based re-sequencing technology would be a welcome innovation.
Sequencing by hybridization (SBH), which uses a similar tiled primer design but differs in principle, has been applied for re-sequencing [1] [2] [3] [4] [5] [6]. Four oligonucleotide probes are queried per nucleotide of reference sequence. Each is identical to the reference sequence except for an A, T, G or C at the central position. Oligonucleotide hybridization can differentiate a matched from a single–base mismatched template because the signal intensities differ [7]. However, mismatched hybridization also generates problematic levels of non-specific signal especially when when 1- and 2-nt microinsertions and microdeletions are present [8]. Other technologies of single-base extension [9] and allele-specific extension [10] are based on direct primer extension by DNA polymerase. However, such systems employ unblocked primers that have low specificity to mismatches, particularly along their lengths.
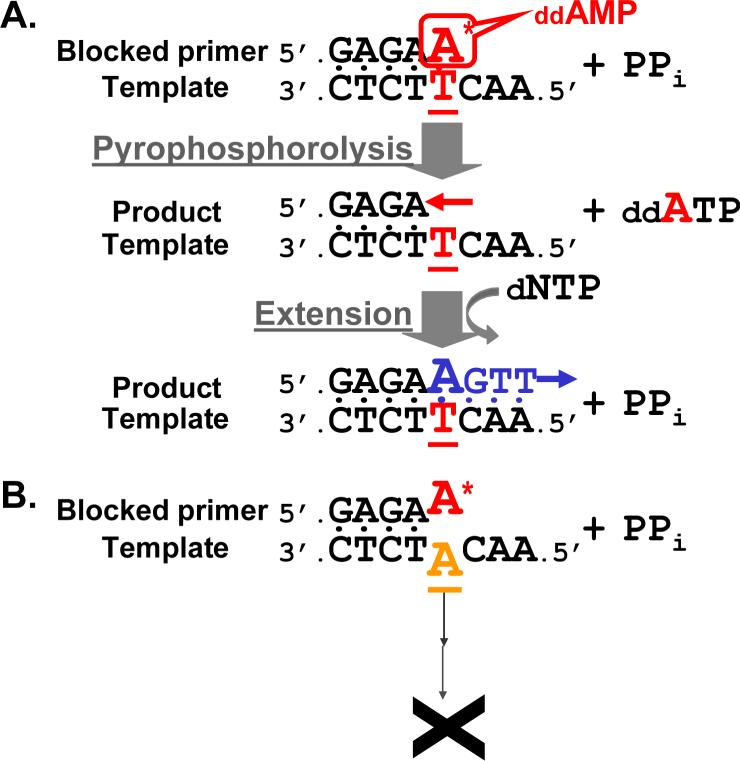
Pyrophosphorolysis-activated polymerization (PAP), a method for nucleic acid amplification using 3' blocked primers (P*s), was originally developed to enhance the specificity of allele-specific PCR [11]. P* primers discriminate mismatches at their 3' ends with ultra-high specificity because pyrophosphorolysis and polymerization are serially coupled by a DNA polymerase (Figure 1). Moreover, P*s exhibit high specificity to mismatches along their lengths in solution [12]. These properties are essential to the development of a PAP resequencing (PAP-R) technique with microarrays.
Figure 1. PAP using 3' blocked primers.
A. Blocked primer matches template. Because the primer is blocked at its 3' end by ddAMP, it cannot be directly extended by DNA polymerase. When the primer anneals to the template strand, the 3' blocker is removed by pyrophosphorolysis in the presence of pyrophosphate. The shortened primer is then extended, generating signal. B. Blocked primer mismatches template at the 3' end. Little or no signal is generated, showing high specificity.
Herein, we demonstrate the feasibility of detecting unknown mutations with PAP-R. As a proof of principal, a 20-nt region of the human F9 gene was re-sequenced. All wild type (WT) samples, single-base substitutions, micro-deletions, and micro-insertions were identified. In many instances, the signal-to-noise ratio between the matched and 3' mismatched blocked primers exceeded 1000. Thus, PAP-R has the potential to be an accurate and high-throughput sequencing method for detecting unknown mutations.
Materials and Methods
Terminology
Pyrophosphorolysis: Removal of the 3' nucleotide by DNA polymerase in the presence of pyrophosphate (PPi). This is the reverse of DNA polymerization.
PAP-R: PAP resequencing for detection of unknown mutations within a known region.
Linear PAP: PAP with only one P* for linear amplification.
P*: 3' dideoxynucleotide blocked primer.
Wt-P*: P* of wild type sequence.
Mut-P*: mutation-specific P* with a mutation at the 3' end.
Signal-to-noise ratio: the relative yield of the matched P* to the mismatched P* for a given template.
3' blocked primer P*s
3' ddCMP-blocked primers were chemically synthesized in 3' to 5' direction by Biosource (Camanillo, California). Each primer also contained a linker of an amino and a spacer of 12- or 18-carbon atoms at its 5' end. To test the purity of P*s a direct extension experiment was used for estimation [11]. Under standard PCR conditions (pH 8.3, 200 μM each of dNTPs, and no PPi added), the blocked P* could not be extended by native Taq polymerase, but the unblocked oligonucleotide was extended to generate a product. Their purities were estimated to be 99.9% (The purity is defined as the ratio of blocked primer to unblocked primer without a blocker).
3' ddAMP, ddTMP or ddGMP blocked primers were chemically synthesized in 5' to 3' direction by Biosource. Each primer also contained a linker of an amino and spacer of 12-carbon atoms at its 5'end. Their purities ranged from 90%−99%.
Templates prepared from oligonucleotide and PCR
A wild type and six mutant 80-nt oligonucleotides were synthesized as single-stranded templates (IDT, Coralville, IA), corresponding to 9402−9481 nt of the human factor IX gene (GenBank accession K02402). The mutant templates contained a G to T at 9442, a T to G at 9430, a T to A at 9430, a delC at 9431, a T to G at 9427, and an insA at 9424, respectively.
Wild type, mutant (containing G:C to C:G at 9428 nt) and heterozygous double-stranded PCR templates were also prepared for Figures 3F, G, and H, respectively. A 152-bp region was amplified by PCR with two primers [F9(9320)21D = 5'ATT CTG AAT CGG CCA AAG AGGT3'; F9(9472)21U = 5'TGC TCT GCA TCT GAA GGG TATT3']. The PCR product was purified using a Centricon 50 microconcentrator (Amicon). The amount of recovered PCR product was determined by UV absorbance at 260 nm.
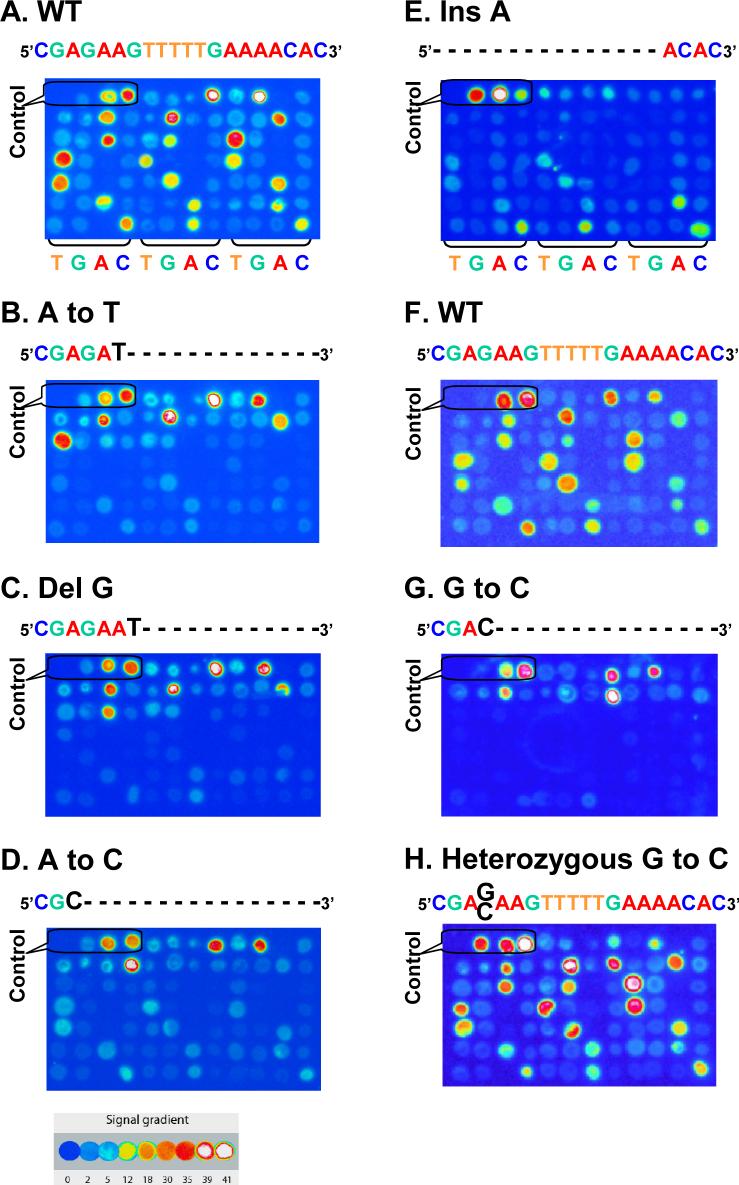
Figure 3. PAP-R on microarray.
Linear PAP was used to re-sequence the WT and mutant samples. Signals were generated by incorporation of [α-33P]-dCTP. Spots of are ordered left-to-right and top-to-bottom. A. WT 80-nt oligonucleotide template (Table 1). B. Mutant (Mut) 80-nt oligonucleotide template containing a T to A mutation. C. Mut oligonucleotide containing a C deletion. D. Mut 80-nt oligonucleotide containing a T to G mutation. E. Mut oligonucleotide containing an A insertion that is located one nucleotide ahead of the calling region. F. WT double-stranded PCR template (152 bp). G. Mut double-stranded PCR containing a G:C to C:G mutation. H. Heterozygous double-stranded PCR containing a G:C to C:G mutation. The four control spots from left to right are blank, 20-mer ddC-blocked P* (5'CACGAGAAGTTTTTGAAAAddC*), 26-mer ddC-blocked P* (5'AAGAAGCACGAGAAGTTTTTGAAAAddC*), and 30-mer ddC-blocked P* (5'TTTGAAGAAGCACGAGAAGTTTTTGAAAAddC*) in Panels A, B, C, D, F, G and H. In Panel E, the control spots are blank, 26-mer ddC-blocked P*, 30-mer ddC-blocked P* and 20-mer ddC-blocked P*.
PAP on microarray
0.2 μl of 25μM 5'-amino-C12−3'ddNMP-blocked P*s were spotted manually with a diameter of ∼2mm on a CodeLink slide (Amersham). The variance was ≤20% among the spots. The post-coupling procedures were performed according to the manufacturer's protocol.
Linear form of PAP was performed on the slides covered with FRAME-SEAL chambers (MJ Research). The reaction mixture contained in a total volume of 75 μl: 50 mM Tris–HCl, pH 7.8, 3.5 mM MgCl2, 16 mM (NH4)2SO4, 15−25 μM each of dNTPs (dATP, dTTP, dGTP and dCTP), 90 μM PPi, 10 μCi of [α-33P]-dCTP 10 (3000Ci/mmole, Amersham), of 10 nM template, and 3U KlenTaq-S (ScienTech). The cycling conditions were 94°C for 30 sec, 60°C for 1 min, 64°C for 1 min, 68°C for 1 min and 72°C for 1 min, for a total of 15 cycles.
The slides were washed in 2×SSC, 0.1% SDS solution at 55 °C for 5 min, for two times. Then the slides were washed in 2×SSC, 0.1% SDS solution at room temperature for 4−8 hrs. After the slides were rinsed in deionized water and air-dried, they were scanned with a Typhoon 9410 Variable Model Imager. The parameters were set as: red laser at 633 nm wavelength, 390 BP filter, and 25 micron resolution. The signal on each spot was quantitated with ImageQuant software (Amersham) as the total amount of count in the spot minus local background, indicated as an arbitrary unit.
Results
Optimization of slides and blocked primers on microarray
We chose CodeLink slides, which are coated with a layer of polyacrylamide, for the microarray because they provide a suitable surface for efficient PAP amplification. P*s were attached to the polyacrylamide through a 5' amino linker.
To search for blocked primers of an optimal length, the effect of size and mismatch of P*s in two regions of the factor IX gene, exons B and H, were tested. Each P* was either wild type or contained a mismatch at the 3' end or at the −12 nt from the 3' end. In addition, P* size varied from 18 to 30 nucleotides. Similar to previous findings in solution [12], 18-mer and 20-mer P*s gave efficient PAP amplification and specificity regarding mismatches at the 3' ends and along their lengths. Similar results to α-P33-dCTP labeling were obtained using fluorescently labeled TAMRA-ddCTP (data not shown).
PAP resequencing on microarray (PAP-R)
Four P*s can determine one nucleotide of the reference sequence. Thus, to resequence a 20-bp genomic region in the factor IX gene (nts 9425−9444, GenBank K02402), a total of eighty 20-mer P*s were designed and spotted on the microarray. The WT and three mutation-specific P*s were identical in sequence except at their 3' dideoxynucleotide, which corresponded to either WT or one of the three possible single-base substitutions (Figures 2).
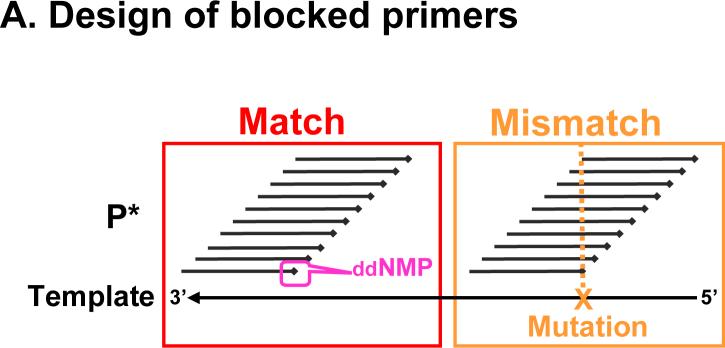
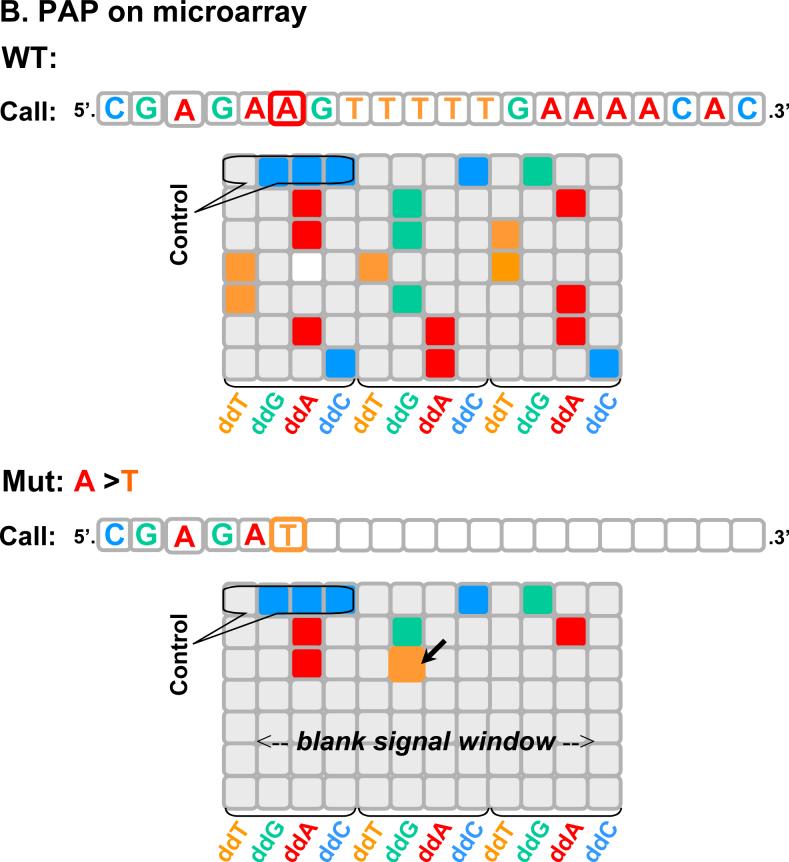
Figure 2. Schematic of PAP-R on microarray to detect an A to T mutation.
A. Design of blocked primers. P*s are tiled along the template with matches (left) or mismatches (right). The X represents a mutation. B. On microarray. The 20-nt region is exampled. With the wild type sample, the WT-P*s generates signal, simulating Panel A of Figure 3. With an A to T mutation, the ddA-Mut-P* gains signal at the mutation position. In addition, the mutation also creates a “gap” of loss of signal for the subsequent 14 nucleotides, simulating Panel B of Figure 3.
Using a linear form of PAP, we re-sequenced WT samples as well as samples possessing single-base substitutions, deletions, and insertions (Table 1). All bases were identified correctly according to relative signal intensity (Figure 3, Supplementary Table 1). For the WT samples, only WT-P*s generated strong signal (Figures 3A and F). For templates with single-base substitutions, the results could be divided into in three categories: i) before the mutation position on the template, only the WT-P*s generated signal; ii) at the mutation position, only one 3' mutation-specific P* (Mut-P*) gained signal since its 3' end matched the mutation; and iii) after the mutation position, there was a ‘gap’, i.e., loss of signal for up to 17-nt (Figures 3B, D and G), because each WT-P* contained one and each Mut-P* contained two mismatches. The small deletion and insertion were readily detected and localized (Figures 3C and E). The sample that contained heterozygous single-base substitution showed a combined pattern of WT and mutation (Figure 3H).
Table 1.
80-nt oligonucleotide templatesa
| Type | Expt | Sequence (3′ to 5′)b |
|---|---|---|
| WT | A | TTTCACATCAAAACTTCTTCGTGCTCTTCAAAAACTTTTGTGACTTTCTTGTCACTCATAAAGGTGTATTATGGGAAGTC |
| T-A | B | TTTCACATCAAAACTTCTTCGTGCTCTACAAAAACTTTTGTGACTTTCTTGTCACTCATAAAGGTGTATTATGGGAAGTC |
| delC | C | TTTCACATCAAAACTTCTTCGTGCTCTT(delC)AAAAACTTTTGTGACTTTCTTGTCACTCATAAAGGTGTATTATGGGAAGTC |
| T-G | D | TTTCACATCAAAACTTCTTCGTGCGCTTCAAAAACTTTTGTGACTTTCTTGTCACTCATAAAGGTGTATTATGGGAAGTC |
| insA | E | TTTCACATCAAAACTTCTTCGT(insA)GCTCTTCAAAAACTTTTGTGACTTTCTTGTCACTCATAAAGGTGTATTATGGGAAGTC |
oligonucleotide templates were used in Figures 3A, B, C, D, and E, respectively.
framed region is the 20-nt re-sequencing region.
Specific signal occurred when a P* matched its template, whereas little or no non-specific signal or noise was generated when a P* mismatched its template at its 3' end. For WT template (Figures 3A and F), the signal-to-noise ratio between the WT-P* and each of the Mut-P*s was quantified for every nucleotide along the reference sequence. In addition, when mutant templates were used (Figures 3B, C, D, E, and G), the signal-to-noise ratio between a matched P* and each of 3' mismatched P*s was quantified before and at the position of mutation. Eight per cent (15/192) of the data points tested exhibited signal-to-noise ratios over 1000, demonstrating that PAP-R has the potential to be highly selective (Table 2). Sixty-seven per cent (128/192) of the data points tested showed signal-to-noise ratios greater than 10. Only 5% of the signal-to-noise ratios (10/189) were less than 4, due to limit of P* purity in which unblocked molecules constitute up to 10% of the molecular population (Footnotes of Table 2). For example, the ddG-Mut-P* at spot of row 3 and column 6 generated high noise.
Table 2.
Summary of signal-to-noise ratios before and at the mutation positiona
| Ex ptb | DNA sample | Signal-to-noise ratio | ||||||
|---|---|---|---|---|---|---|---|---|
| Mutation Typec | Locationc | Size | No. of S/Nd | Mediane | Average | Minimumf | Maximumg | |
| A | WT | 80-nt single strand | 60 | 17.4 | 150.0 | 1.4 | >1000 | |
| B | A to T | 6 | 80-nt single strand | 18 | 15.0 | 67.7 | 4.1 | >1000 |
| C | Del G | 7 | 80-nt single strand | 21 | 10.5 | 106.2 | 1.7 | >1000 |
| D | A to C | 3 | 80-nt single strand | 9 | 9.8 | 121.7 | 5.2 | >1000 |
| F | WT | 152-bp double strand | 60 | 16.2 | 162.1 | 1.3 | >1000 | |
| G | G to C | 4 | 152-bp double strand | 12 | 17.6 | 19.4 | 5.3 | 52.7 |
| H | Heterozygous G to C | 4 | 152-bp double strand | 12 | 18.9 | 22.2 | 1.5 | 87.0 |
data are shown in Figure 3. In each set of four P*s, the signal-to-noise ratio is defined as the signal ratio between the matched P* and each of the three 3′ mismatched P*s.
panel E is not included because the insertion is located ahead of the re-sequencing region.
the mutation type is indicated on the sense strand. The mutation position is numbered assigning the first nucleotide in the target region as 1.
with the wild type template, 60 signal-to-noise ratios were analyzed in 20 sets of P*s or 80 P*s. In Panel B with a mutant template, an A to T mutation is located at 6th nt of the re-sequencing region. Eighteen signal-to-noise ratios were analyzed in 6 sets of P*s.
the difference between the average and median is large because many signal-to-noise ratios are >1000.
the minimum signal-to-noise ratio is small because of high noise from contaminated unblocked primer. For example, the following spots had high noise at the mutation position: the ddT-Mut-P* at spot of row 3 column 5 on Panel A, the ddA-Mut-P* at spot of row 3 and column 3 on Panel B, the ddG-Mut-P* at spot of row 3 and column 6 on Panel C, the ddT-Mut-P* at spot of row 1 and column 9 on Panel D, the ddT-Mut-P* at spot of row 1 and column 9 on Panel G, and the ddT-Mut-P* at spot of row 1 and column 5 on Panel H.
A maximum of 1000 is taken.
Importantly, at nucleotide positions located after the mutation (Figures 3B, C, D, E, and G), loss of signal occurred up to a distance of 17 bases. Note that within this “gap”, a WT-P* has one mismatch along its length when annealed to the mutant template, whereas a Mut-P* has two mismatches, one at its 3'end and the second along its length. In such cases, signal is defined as the average specific signal of the matched P*s before and at the mutation position, whereas noise is the non-specific signal of each mismatched P* after the mutation. Fifteen per cent (36/241) of these signal-to-noise ratios were over 1000 (Table 3).
Table 3.
Summary of signal-to-noise ratios after the mutation positiona
| Ex ptb | DNA sample | Signal-to-noise ratio | ||||||
|---|---|---|---|---|---|---|---|---|
| Type | Location | Size | No. S/Nc | Mediand | Averaged | Minimume | Maximumf | |
| B | A to T | 6 | 80-nt single strand | 56 | 160.2 | 311.3 | 4.5 | >1000 |
| C | Del G | 7 | 80-nt single strand | 53 | 205.4 | 878.0 | 7.4 | >1000 |
| D | A to C | 3 | 80-nt single strand | 68 | 106.7 | 273.0 | 4.8 | >1000 |
| G | G to C | 4 | 152-bp double strand | 64 | 158.4 | 162.3 | 5.9 | 353.7 |
data are shown in Figure 3. The signal is the average level of signals generated by matched P*s before and at the mutation position. The noise is the level of signal generated by each mismatched P* after the mutation position.
panels B, C, D and G were analyzed.
the number of sets of P*s were analyzed after the mutation position.
the difference between the average and median is large because many signal-to-noise ratios are >1000.
in each panel, the minimum signal-to-noise ratio is small because of high noise from contaminated unblocked primer. For instance, the following spots exhibited high noise after the mutation position: the ddT-Mut-P* at spot of row 3 and column 5 on Panel B, the ddT-WT-P* at spot of row 5 and column 1 on Panel D, and the ddC-Mut-P* at spot of row 2 and column 12 on Panel G.
a maximum of 1000 is taken.
In the case of the heterozygous sample, the mutation was clearly identified (Figure 3H). At the mutation position, both the ddG-WT-P* and the corresponding ddC-Mut-P* produced strong signal. After the mutation position in the ‘gap’ area, signal level is expected to drop 50% because only 50% of the total amount of template generates product. The actual relative signal levels of the 16 WT-P*s decreased to 65% compared with the median level of the WT sample F. Moreover, the relative levels from the 48 Mut-P*s also decreased by 50%.
Discussion
Early in its development, expense and primer quality limited the applications of PCR. This is currently the case for PAP-R. At present, only ddC-bound resins are commercially available for 3' to 5' phosphoamidite synthesis. In this study, because the ddA-, ddT-, and ddG-blocked primers were synthesized in the 5' to 3' direction, P* purity was variable.
A particularly attractive form of PAP-R would combine PAP with maskless photochemical 5' to 3' primer synthesis by digital mirror-based combinatorial parallel synthesis of primers on microarray [13] [14]. This flexible alternative to a large number of photolithographic masks uses virtual masks generated on a computer that are relayed to a digital micromirror. By repeating cycles of programmed chemical coupling with virtual masks, it is possible to synthesize a primer array with any desired sequence. In addition to the 3' to 5' synthesis, the primers can also be synthesized in the 5' to 3' direction on micrarray [15]and blocked by dideoxy- or acyclo-nucleotides at the 3'-termini. The technology has the potential to be economical because tens of thousands of P*s could be synthesized in parallel.
We have demonstrated that a 20-nt region of the human factor IX gene can be re-sequenced on a microarray using PAP-R. Theoretically, any unknown single-base substitution can be determined by performing PAP-R in sense as well as antisense directions. Unknown small deletions and insertions can be detected and localized as well. By combining microarray technology, PAP-R using 3' blocked primers has two advantages: i) signal-to-noise ratios are extremely high between matches and 3' mismatches, and ii) P*s have high specificity along their lengths. Thus, using PAP-R, hundreds of thousands of P*s could be processed in parallel without ambiguous base calling. To realize this potential, more work will be needed for better synthesis of 3' dideoxynucleotide blocked primers. In principal, any 3' blockers susceptible to pyrophosophorolysis could be used for PAP-R
ACKNOWLEDGMENT
The work is partially supported by NIH R33 CA94334 grant. We thank William Scaringe and Cameron Mroske for their critical comments.
Footnotes
Publisher's Disclaimer: This is a PDF file of an unedited manuscript that has been accepted for publication. As a service to our customers we are providing this early version of the manuscript. The manuscript will undergo copyediting, typesetting, and review of the resulting proof before it is published in its final citable form. Please note that during the production process errors may be discovered which could affect the content, and all legal disclaimers that apply to the journal pertain.
Supplementary Material
Reference
- 1.Southern EM, Maskos U, Elder JK. Analyzing and comparing nucleic acid sequences by hybridization to arrays of oligonucleotides: evaluation using experimental models. Genomics. 1992;13:1008–1017. doi: 10.1016/0888-7543(92)90014-j. [DOI] [PubMed] [Google Scholar]
- 2.Lipshutz RJ, Morris D, Chee M, Hubbell E, Kozal MJ, Shah N, Shen N, Yang R, Fodor SP. Using oligonucleotide probe arrays to access genetic diversity. BioTechniques. 1995;19:442–447. [PubMed] [Google Scholar]
- 3.Chee M, Yang R, Hubbell E, Berno A, Huang XC, Stern D, Winkler J, Lockhart DJ, Morris MS, Fodor SP. Accessing genetic information with high-density DNA arrays. Science. 1996;274:610–614. doi: 10.1126/science.274.5287.610. [DOI] [PubMed] [Google Scholar]
- 4.Hacia JG, Brody LC, Chee MS, Fodor SP, Collins FS. Detection of heterozygous mutations in BRCA1 using high density oligonucleotide arrays and two-colour fluorescence analysis. Nat.Genet. 1996;14:441–447. doi: 10.1038/ng1296-441. [DOI] [PubMed] [Google Scholar]
- 5.Ginot F. Oligonucleotide micro-arrays for identification of unknown mutations: how far from reality? Hum Mutat. 1997;10:1–10. doi: 10.1002/(SICI)1098-1004(1997)10:1<1::AID-HUMU1>3.0.CO;2-P. [DOI] [PubMed] [Google Scholar]
- 6.Hacia JG, Collins FS. Mutational analysis using oligonucleotide microarrays. J Med Genet. 1999;36:730–736. doi: 10.1136/jmg.36.10.730. [DOI] [PMC free article] [PubMed] [Google Scholar]
- 7.Wallace RB, Shaffer J, Murphy RF, Bonner J, Hirose T, Itakura K. Hybridization of synthetic oligodeoxyribonucleotides to phi chi 174 DNA: the effect of single base pair mismatch. Nucleic Acids Res. 1979;6:3543–3557. doi: 10.1093/nar/6.11.3543. [DOI] [PMC free article] [PubMed] [Google Scholar]
- 8.Karaman MW, Groshen S, Lee CC, Pike BL, Hacia JG. Comparisons of substitution, insertion and deletion probes for resequencing and mutational analysis using oligonucleotide microarrays. Nucleic Acids Res. 2005;33:e33. doi: 10.1093/nar/gni034. [DOI] [PMC free article] [PubMed] [Google Scholar]
- 9.Syvanen AC. From gels to chips: “minisequencing” primer extension for analysis of point mutations and single nucleotide polymorphisms. Hum Mutat. 1999;13:1–10. doi: 10.1002/(SICI)1098-1004(1999)13:1<1::AID-HUMU1>3.0.CO;2-I. [DOI] [PubMed] [Google Scholar]
- 10.Kaller M, Ahmadian A, Lundeberg J. Microarray-based AMASE as a novel approach for mutation detection. Mutat.Res. 2004;554:77–88. doi: 10.1016/j.mrfmmm.2004.03.009. [DOI] [PubMed] [Google Scholar]
- 11.Liu Q, Sommer SS. Pyrophosphorolysis activated polymerization (PAP): application to allele-specific amplification. BioTechniques. 2000:1072–1080. doi: 10.2144/00295rr03. [DOI] [PubMed] [Google Scholar]
- 12.Liu Q, Sommer SS. Pyrophosphorolysis-activatable oligonucleotides may facilitate detection of rare alleles, mutation scanning and analysis of chromatin structures. Nucleic Acids Res. 2002;30:598–604. doi: 10.1093/nar/30.2.598. [DOI] [PMC free article] [PubMed] [Google Scholar]
- 13.Singh-Gasson S, Green RD, Yue Y, Nelson C, Blattner F, Sussman MR, Cerrina F. Maskless fabrication of light-directed oligonucleotide microarrays using a digital micromirror array [see comments] Nat Biotechnol. 1999;17:974–978. doi: 10.1038/13664. [DOI] [PubMed] [Google Scholar]
- 14.LeProust E, Pellois JP, Yu P, Zhang H, Gao X, Srivannavit O, Gulari E, Zhou X. Digital light-directed synthesis. A microarray platform that permits rapid reaction optimization on a combinatorial basis. J Comb Chem. 2000;2:349–354. doi: 10.1021/cc000009x. [DOI] [PubMed] [Google Scholar]
- 15.Albert TJ, Norton J, Ott M, Richmond T, Nuwaysir K, Nuwaysir EF, Stengele KP, Green RD. Light-directed 5'-->3' synthesis of complex oligonucleotide microarrays. Nucleic Acids Res. 2003;31:e35. doi: 10.1093/nar/gng035. [DOI] [PMC free article] [PubMed] [Google Scholar]
Associated Data
This section collects any data citations, data availability statements, or supplementary materials included in this article.


