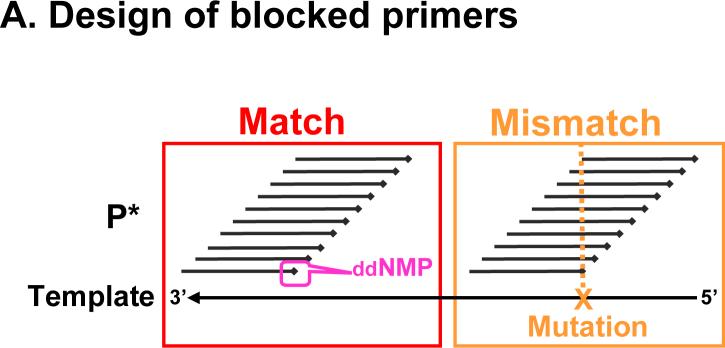
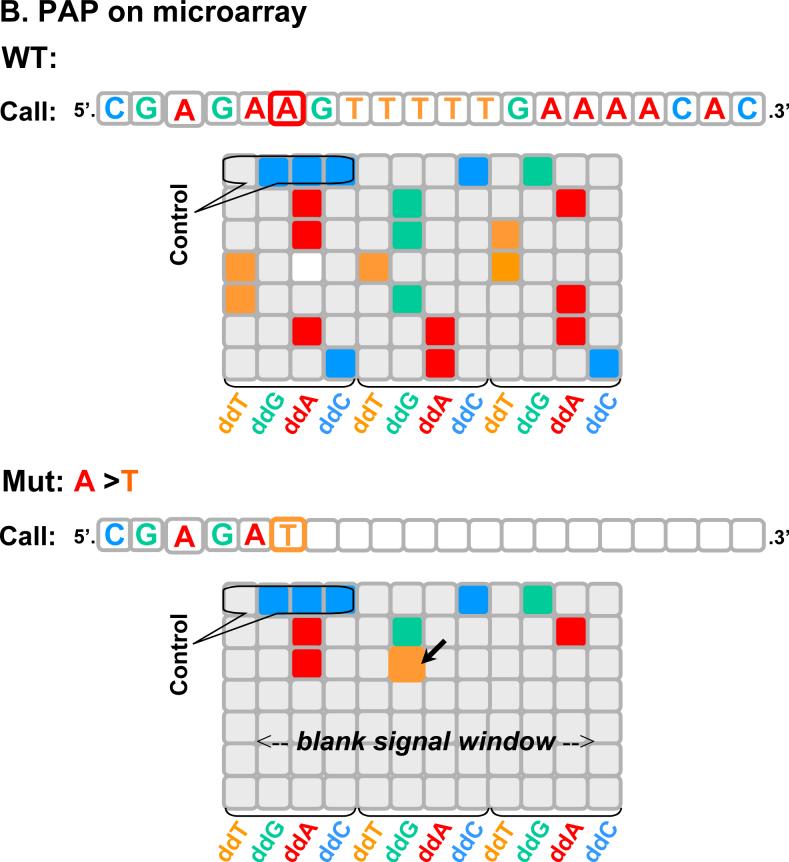
Figure 2. Schematic of PAP-R on microarray to detect an A to T mutation.
A. Design of blocked primers. P*s are tiled along the template with matches (left) or mismatches (right). The X represents a mutation. B. On microarray. The 20-nt region is exampled. With the wild type sample, the WT-P*s generates signal, simulating Panel A of Figure 3. With an A to T mutation, the ddA-Mut-P* gains signal at the mutation position. In addition, the mutation also creates a “gap” of loss of signal for the subsequent 14 nucleotides, simulating Panel B of Figure 3.


