
Figure 5.
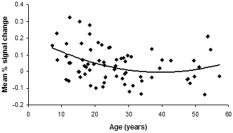
The mean percent signal change averaged across voxels in the subgenual anterior cingulate (BA 24, Tal x, y, z = 10, 19, 9 mm) plotted against age showing the curvilinear developmental trajectory of Stroop‐related activation.
Official websites use .gov
A
.gov website belongs to an official
government organization in the United States.
Secure .gov websites use HTTPS
A lock (
) or https:// means you've safely
connected to the .gov website. Share sensitive
information only on official, secure websites.
The mean percent signal change averaged across voxels in the subgenual anterior cingulate (BA 24, Tal x, y, z = 10, 19, 9 mm) plotted against age showing the curvilinear developmental trajectory of Stroop‐related activation.