
Figure 7.
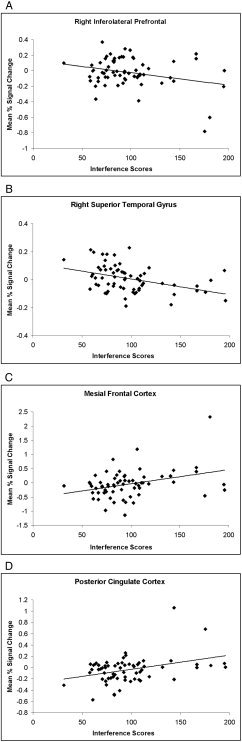
The mean percent signal change averaged across voxels in the right inferolateral prefrontal cortex (A; BA 46, Tal x, y, z = −39, 34, 18 mm) and right superior temporal gyrus (B; BA 22, Tal = −53, −38, 9) plotted against interference scores showing that deactivation in these clusters of voxels increased with poorer performance. The mean percent signal change averaged across voxels in mesial frontal cortex (C; BA 10, Tal = 4, 58, 0) and posterior cingulate cortex (D; BA 31, Tal = 3, −52, 27) plotted against interference scores showing that activation in these clusters of voxels increased with poorer performance.