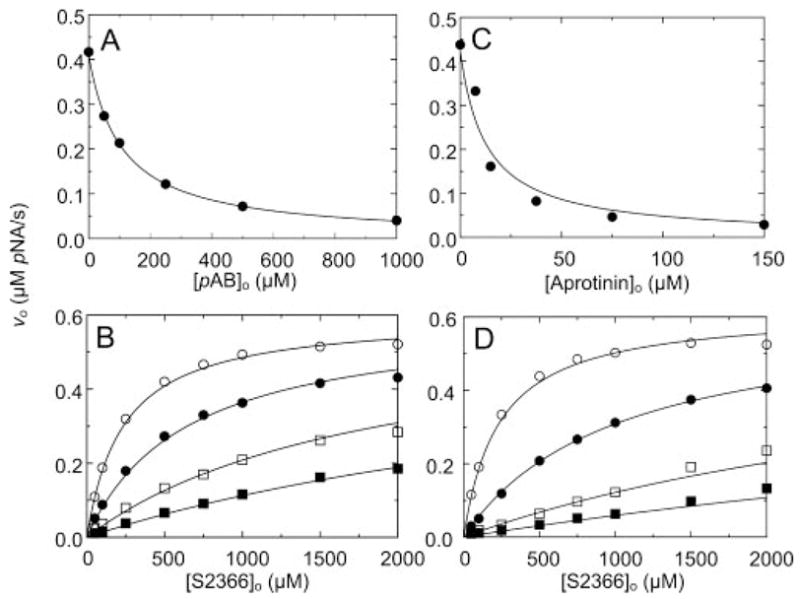
Fig. 1. Inhibition of fXIa cleavage of S2366 by pAB and aprotinin.

Initial velocities of S2366 hydrolysis by 6 nM fXIa active sites (υo) as a function of pAB concentration ([pAB]o) (A) or aprotinin concentration ([Aprotinin]o) (C) at 0.5 mM S2366; and as a function of S2366 concentration ([S2366]o) at fixed concentrations of pAB of 0 (○), 50 (●), 200 (□), and 500 (■) (B) or aprotinin, 0 (○), 3.8 (●), 15 (□), and 45 μM (■) (D) are shown. Data shown are means for three separate experiments. The lines represent the least-squares fits to the data with the parameters listed in Table I. Initial rates were measured and analyzed as described under “Experimental Procedures.” pNA, p-nitroaniline.
