
Fig. 3. Kinetic parameters for fIX cleavage by fXIa.
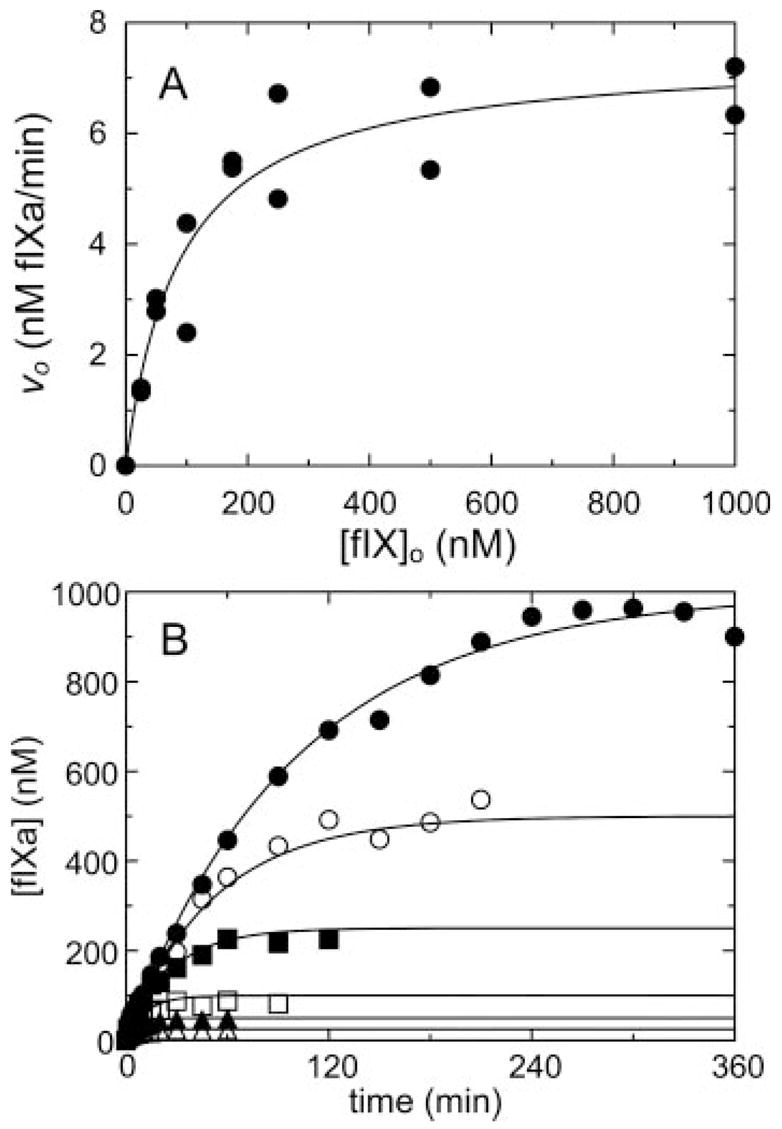
A, initial rates of fIX hydrolysis by 0.4 nM fXIa active sites (υo) as a function of fIX concentration ([fIX]o). B, progress curves of fIXa generation ([fIXa]) from fIX at 25 (△), 50 (▲), 100 (□), 250 (■), 500 (○), and 1000 nM (●). The lines represent the least-squares fits to the data with the parameters listed in Table I. Rates were measured and analyzed as described under “Experimental Procedures.”