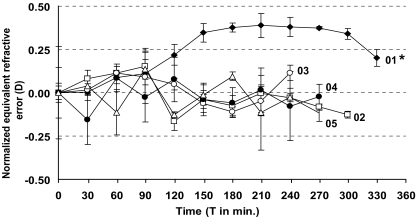
Fig. 2.
Graph of the normalized equivalent refractive error (ERE) in diopters (D) of the five subjects. Data are presented as mean±SD; three measurements were made of each subject every 30 minutes during the procedure. Data are normalized by subtracting the value at baseline from the measured value in each subject. The oral glucose load was administered at T 0. * Significant difference between ERE at T 0 and T 210 (maximal hyperglycemia), p < 0.001

