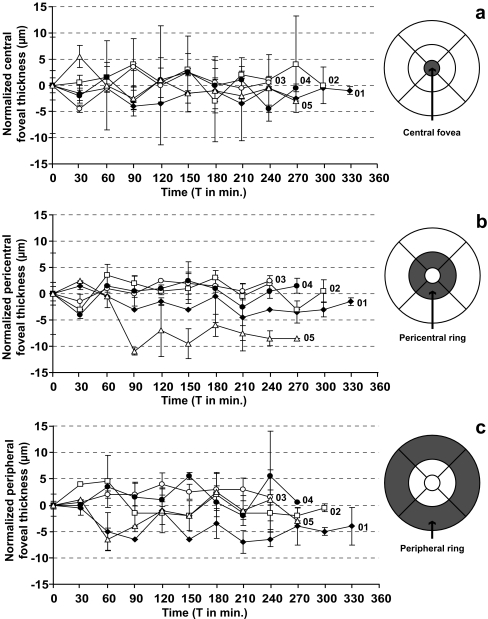
Fig. 3.
Graphs and maps of normalized retinal thickness parameters in the five subjects during hyperglycemia: (a) central fovea, (b) pericentral fovea, (c) peripheral fovea. Data are normalized by subtracting the value at baseline from the measured value in each subject. Each measured area has been indicated by a dark grey area on the retinal maps. No significant changes in retinal parameters were found in any of the subjects. The oral glucose load was administered at T 0

