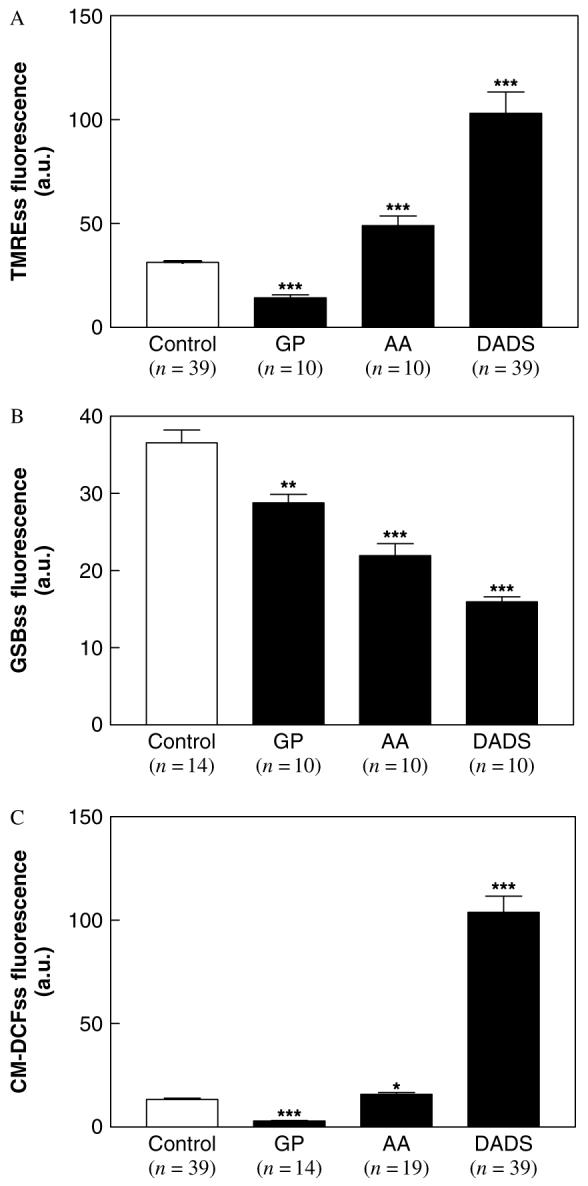
Figure 4.

Quantifying the effects of garlic components on different cellular variables from two-photon microscopy images. Culture-grown C. albicans cells were harvested in early stationary phase, as described in Materials and methods, and exposed to different garlic components at room temperature. The steady-state level of fluorescence (mean of maximal fluorescence intensity) from TMRE, GSB and CM-DCF probes were determined after 30 min treatment with 0.5 mm DADS, or 1.0 mm AA or 5 mg/ml GP. ***p < 0.001; **p < 0.01; *p < 0.05 vs. control. AA, allyl alcohol; GP, garlic powder
