
FIGURE 4. ROS production, ΔΨm, and NADH in permeabilized cardiomyocytes in the presence of IMAC or PTP inhibitors.
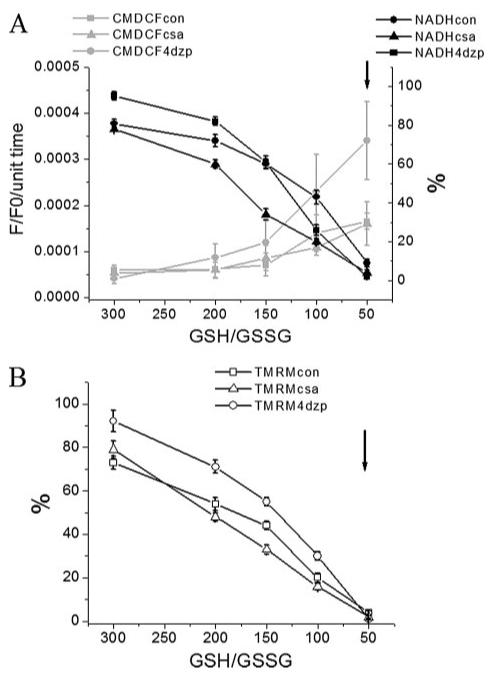
Myocytes were handled, loaded with the ΔΨm and ROS sensors, and permeabilized as described in the legend of Fig. 3. Rate of oxidation of the ROS probe (F/F0/unit time), NADH (in % of initial fluorescence before permeabilization) (A), and ΔΨm (in % of initial TMRM fluorescence before permeabilization) (B) obtained from four cells in the absence or the presence of 60 μm 4CL-DZP or 1 μm CsA (mean ± S.E.; 2 experiments) at different GSH/GSSG ratios (3 mm GSH concentration). The arrows in A and B denote the point at which ΔΨm irreversibly collapsed. Key to symbols: con, control; csa, cyclosporin A; 4dzp, 4Cl-DZP.