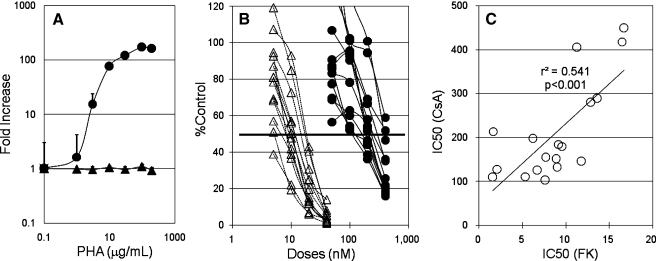
Fig. 3.
PHA-induced IL-2 mRNA expression in human whole blood. A Blood samples were stimulated with various concentrations of phytohemagglutinin-P (PHA) or control (PBS) for 1 h, then IL-2 (filled circle) and β-actin (filled triangle) mRNA were quantified using TaqMan as described in the Methods. B Blood samples were pretreated with 50–400 nM of CsA (filled circle) or 5–40 nM of FK506 (open triangle) for 1 h, then stimulated with 30 μg/ml of PHA or control PBS at 37°C for another 1 h. The %Control was calculated by using the values of PBS (no PHA) and PHA (no inhibitor) as 0 and 100%, respectively, for each individual. C The IC50 of both CsA (y-axis) and FK506 (x-axis) was plotted. Each data point is the mean ± SD (A) or mean (B, C) from each individual. The regression line, r2, and p value are shown in the subpanel C.

