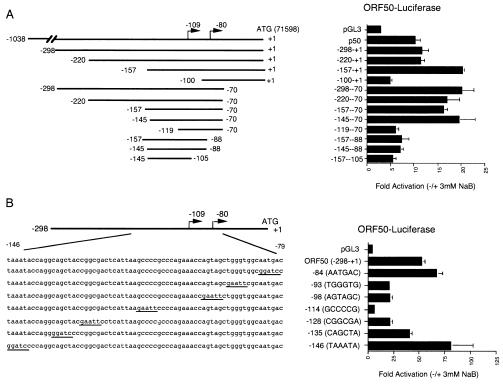
FIG. 2.
Mutational analysis of ORF50 promoter response to NaB. (A) 5′ and 3′ deletion mutants of ORF50 were transfected into BCBL-1 cells and assayed for luciferase activity in the presence or absence of NaB. Luciferase activity is displayed as activation (n-fold) in response to NaB. Schematic diagrams of deletion mutants are shown to the left. The ATG start site is indicated as +1 and corresponds to position 71598 in the KSHV genome. (B) Substitution mutants of ORF50 (−298/+1) were assayed for NaB induction in JSC1 cells. Substitution mutations were indicated by underlined sequences in the schematic to the left.

