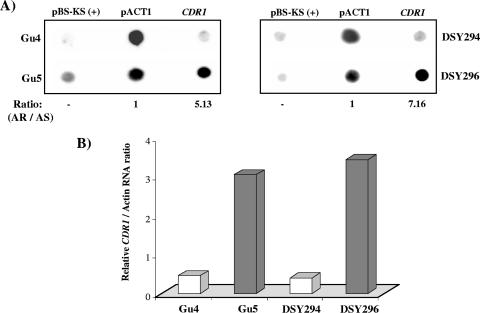
FIG. 5.
TRO analysis of AS and AR isolates. (A) Approximately 2 μg (each) of CDR1, pACT1, and empty vector pBlueScript-KS(+) DNA was blotted and immobilized on charged nylon membranes (Hybond-N+; Amersham Pharmacia Biotech) using a dot blot assembly apparatus. The blots were probed with total labeled nuclear run-on RNA as described in Materials and Methods. Hybridization signal intensities of nuclear RNA were quantified using densitometry scanning of phosphorimages. DNA from a pBlueScript-KS(+) plasmid was used as a negative control for nonspecific binding of nuclear RNA to a random DNA fragment. Signal intensities for each isolate were subtracted from the negative control values and subsequently normalized to the intensity corresponding to their AS isolate. The AR/AS ratio is the normalized nuclear RNA intensity between AR and AS isolates. (B) The relative intensity of CDR1 with respect to actin RNA of each isolate is plotted.

