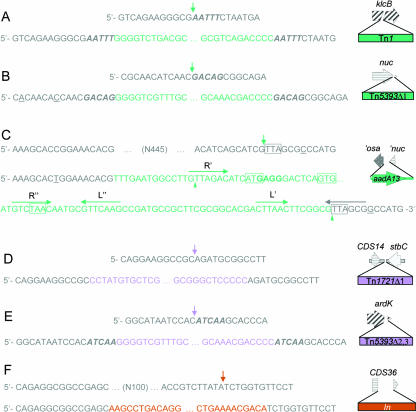
FIG. 3.
Junction sequences of specific insertions. Each insertion is represented at the right by a diagram following the color scheme used in Fig. 1 and is preceded by two DNA sequences. The top one represents the backbone sequence (gray) where the insertion takes place. The exact point of insertion is depicted by a vertical arrow. The bottom sequence contains the corresponding insertion colored according to the same scheme. Target duplications of the backbone sequence are shown in bold italics. Individual base changes with respect to the backbone sequence are underlined. In panel C, two green triangles indicate suggested recombination crossover points flanking the aadA13 integrated cassette. Gene aadA13 start and stop codons as well as the complementary sequence of the nuc stop codon are boxed. A putative ribosome binding site is shown in bold. Core (R′), inverse core (R"), and internal IR (L′ and L") sequences of the potentially recircularized aadA13 cassette are signaled by horizontal green arrows, while the composite core site of the integrated cassette is indicated by a horizontal gray arrow. ′osa, 5′ portion of osa has been deleted; ′nuc, 5′ portion of nuc has been deleted.

