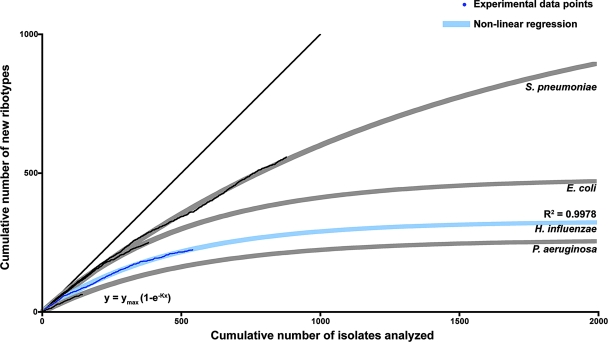
FIG. 5.
Estimation of the number of H. influenzae isolates necessary to analyze by EcoRI ribotyping in order to reach species diversity. A randomized list of ribotyped isolates was generated. For each isolate (x axis), the y value increases by 1 if the isolate represents a new ribotype profile not previously identified in the randomized set. The resulting plot is depicted in dark blue, with fitted nonlinear regression in light blue. The model used for the nonlinear regression is the one-phase exponential association function y = ymax(1 − e−Kx). As the data set increases and becomes more representative of species diversity, fewer new clusters appear, and the tangent to the regression curve tends toward a slope of 0, at which point one can estimate both the number of possible ribotype profiles attainable and the approximate number of isolates required in order to achieve this maximal representation of the diversity of the species. This analysis was performed for three other bacterial species, shown here for comparison purposes in light gray (fitted nonlinear regression) and black (experimental data). For the four bacterial species, the nonlinear regression analysis of ribotype polymorphisms is in accord with the previously established degree of clonality/panmixia: significantly more polymorphic profiles are predicted for the panmictic S. pneumoniae than for the relatively clonal H. influenzae.

