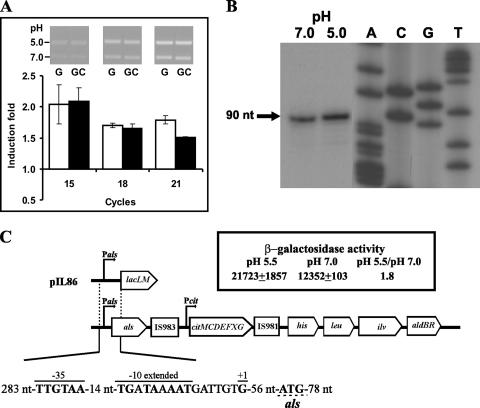
FIG. 2.
Transcriptional analysis of als expression. (A) RT-PCR analysis of als mRNA levels in Lactococcus bv. diacetylactis strain CRL264 grown in M17G (G) or M17GC (GC) medium at pH 5.0 or 7.0 (see details in Materials and Methods). The inset presents an example of analysis of the RT-PCRs in 1% agarose gel; amplicons obtained with RNA from cultures grown at pH 5.0 and at 7.0 are shown in each lane. The bands obtained from three determinations after the indicated PCR cycles were quantified, and the ratio of values obtained at pH 5.0 and 7 were calculated. The mean values of the ratios (fold induction), as well as the standard deviation versus PCR cycles, are depicted. (B) Primer extension analysis of the als transcriptional initiation site in CRL264 grown in M17G at pH 7.0 and 5.0. The extension product is indicated by the arrow (+1). (C) Organization of the Lactococcus bv. diacetylactis als gene and downstream regions, with a schematic representation of pIL86 and the β-galactosidase activity encoded by IL1403(pIL86) grown in M17G at the indicated pHs. In the sequence of the als promoter region, the upper lines indicate the −35 box, the −10 extended box, and the transcriptional start site (+1). The translational start site is underlined. The location and size of the fragment fused to the lacLM reporter gene of L. mesenteroides in pIL86 are also shown.

