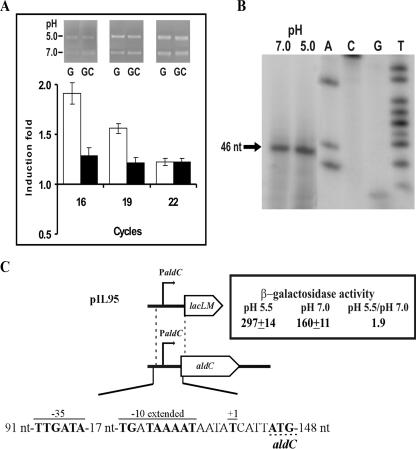
FIG. 4.
Transcriptional analysis of aldC expression. (A) RT-PCR analysis of aldC mRNA expression levels in CRL264 grown in M17G or M17GC medium at pH 5.0 or 7.0. The results are depicted as in Fig. 2. (B) Analysis of the initiation of transcription from aldC promoter determined by primer extension in CRL264 grown in M17G at pH 7.0 and 5.0. The extension product is indicated by an arrow (+1). (C) Schematic representation of the Lactococcus bv. diacetylactis aldC gene, with representation of pIL77 and the β-galactosidase activity encoded by IL-1403(pIL77) grown in M17G at the indicated pHs. The location and size of the fragment fused with the lacLM reporter gene from L. mesenteroides is also shown. In the sequence of the aldC promoter region, the upper lines indicate the −35 box, the −10 extended box, and the transcriptional start site (+1). The translational start site is underlined with the discontinuous line.

