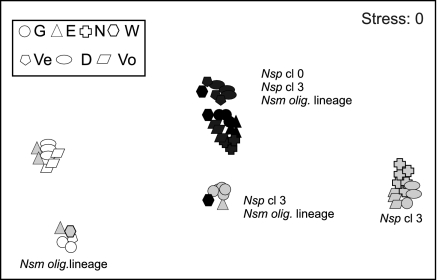
FIG. 3.
Multidimensional scaling plot of AOB communities of the benthic, pelagic, and epiphytic compartments based on the results of PCR approach I. Calculations were done from similarity matrices based on the abundance of AOB-related bands per AOB lineage or cluster. Different shapes are used to indicate samples from different lakes: G, Gooimeer; E, Eemmeer; N, Nuldernauw; W, Wolderwijd; Ve, Veluwemeer; D, Drontermeer; and Vo, Vossemeer. Black, white, and gray correspond to the benthic, pelagic, and epiphytic compartments, respectively. Nsm olig., Nitrosomonas oligotropha lineage; Nsp, Nitrosospira lineage; cl, cluster.

