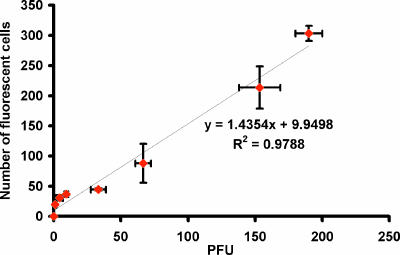
FIG. 4.
The correlation between the number of fluorescent cells and the number of PFU at 6 h p.i. The fluorescent images from 30 different fields within a chosen chamber well were captured under a fluorescence microscope at ×100 magnification. The numbers of fluorescent cells were recorded and averaged. The 8-day plaque assay was performed to confirm the average infectious doses. Error bars represent the standard deviations for three replicates.

