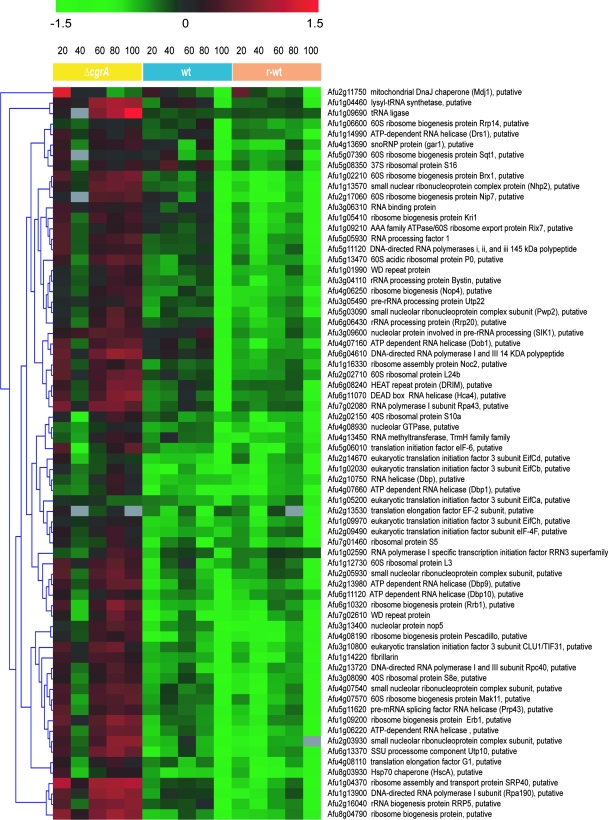
FIG. 4.
Expression profile of mRNAs involved in the translational machinery. Clustered display of translational machinery mRNAs that were increased in the ΔcgrA mutant relative to the wt following a shift from 30°C to 37°C. Colors represent the observed expression ratios on a log2 scale at 20, 40, 60, 80, and 100 min following the temperature shift. All measurements are relative to the measurement at time zero. A total of 70 translational machinery genes were clustered based on similar expression patterns using a hierarchical clustering algorithm.

