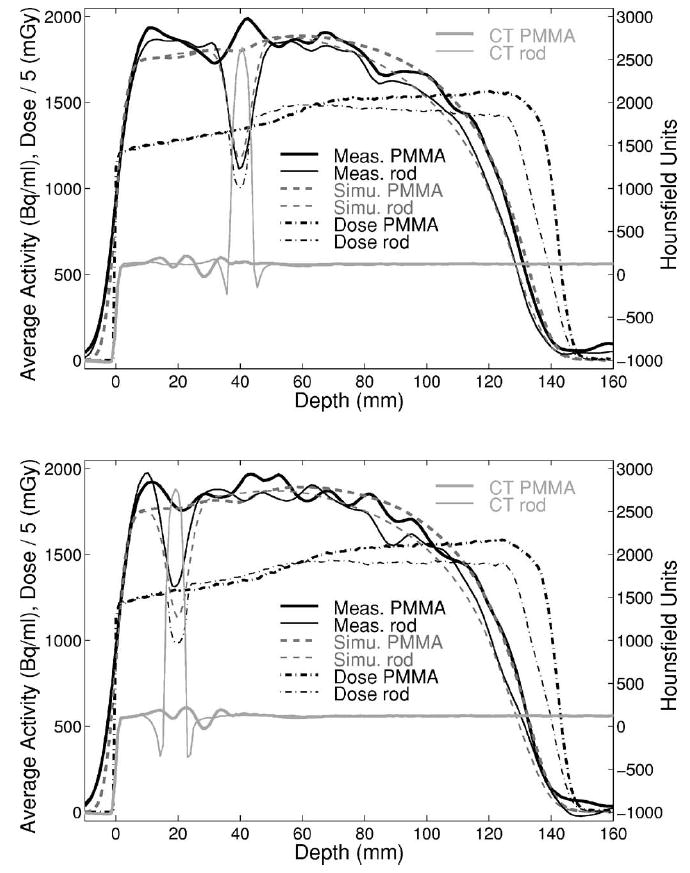
Fig. 13.

Measured activity (solid line) against the MC activity (dashed) and dose (dash-dotted, divided by a factor 5) perfect geometry predictions (I). Depth profiles crossing and not crossing the two rods at two different axial positions are shown by narrow and thick lines, respectively. Corresponding CT profiles are displayed in light gray.
